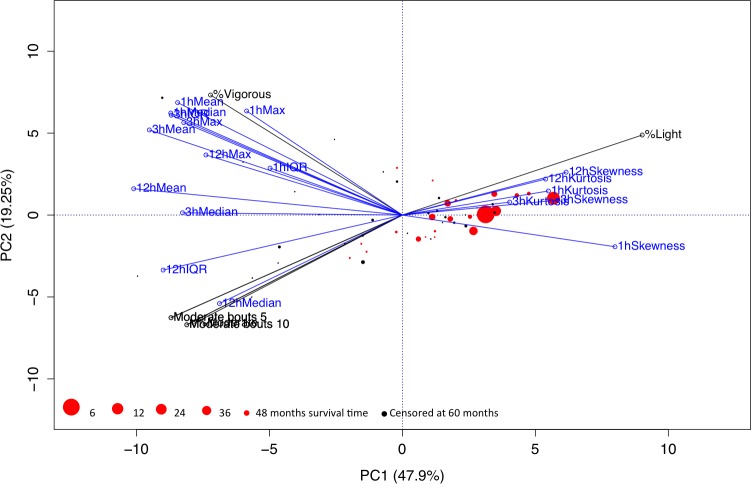
Fig 2. Principal components analysis (PCA) and biplot of all accelerometer derived variables.
Variables measuring time spent physically active/inactive are colored black whereas novel variables based on periods with high physical activity are colored blue. Patient observations are colored black for censored data (survivors) and red for mortality events. The size of each observation corresponds to time until event, i.e. large circles correspond to early event and worse prognosis. Most of the total variance is captured with the two first principal components (69.15%) and the various variables thus covary to a large extent. The absolute majority of the observations with mortality events, in particular observations with early mortality events, are closely correlated with 1, 3 and 12 h skewness and 1, 3 and 12 h kurtosis.

