Figure 2.
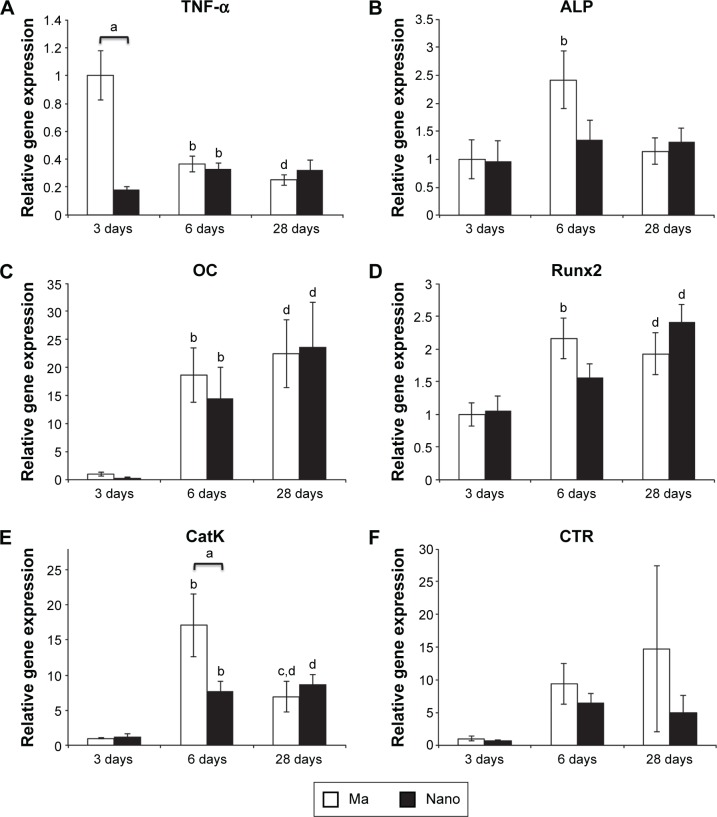
Gene expression analysis of the implant-adherent cells.
Notes: The column graphs show the gene expression in the implant-adherent cells of Ma and Nano titanium implants. The implants were retrieved, by unscrewing, after 3, 6, and 28 days. (A) TNF-α. (B) ALP. (C) OC. (D) Runx2. (E) CatK. (F) CTR. The data show the mean and standard error of the mean (n=8). Statistically significant differences (P<0.05) are indicated by small letters: a= statistically significant difference between the two implant types at each time point; b= statistically significant difference between 3 and 6 days for each implant type; c= statistically significant difference between 6 and 28 days for each implant type; d= statistically significant difference between 3 and 28 days for each implant type.
Abbreviations: Ma, machined; Nano, nanopatterned.

