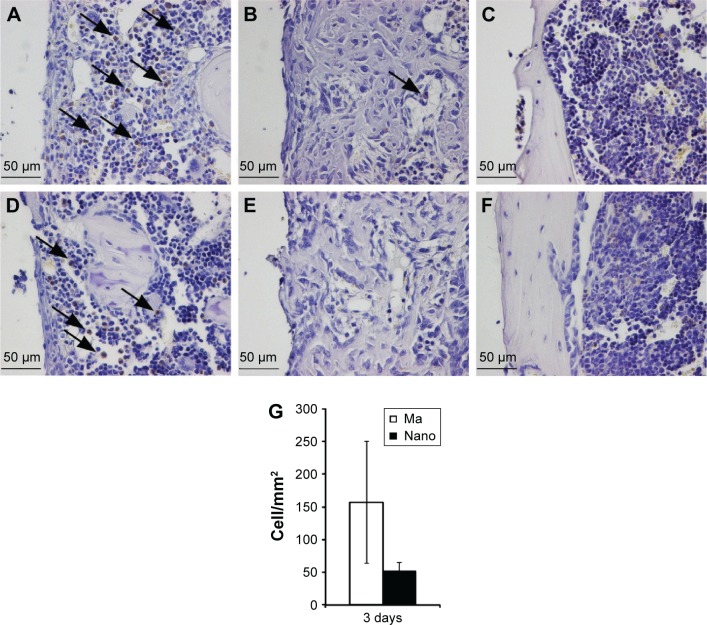
Figure 4.
Immunohistochemical analysis of CD163-positive cells.
Notes: The sections show the positively stained cells, monocytes and macrophages, at Ma (A–C) and Nano (D–F) implants. The analysis was performed at 3 days (A and D), 6 days (B and E), and 28 days (C and F). At 3 days, a higher amount of CD163-positive cells can be seen at the Ma implants compared to the Nano implants (denoted by arrows). After 6 days, a low number of stained cells can be seen on both surfaces, while at 28 days, monocytes/macrophages are not evident in the periimplant tissue. The column graph (G) shows the quantification of CD163-positively stained cells counted along the interface, extending 200 µm from the implant surface, and expressed as number of cells/mm2. The quantification was only performed on the 3-day sections (n=3), where well-preserved sections were used, showing an intact entire interface, at both sides of the implant.
Abbreviations: Ma, machined; Nano, nanopatterned.

