Figure 5.
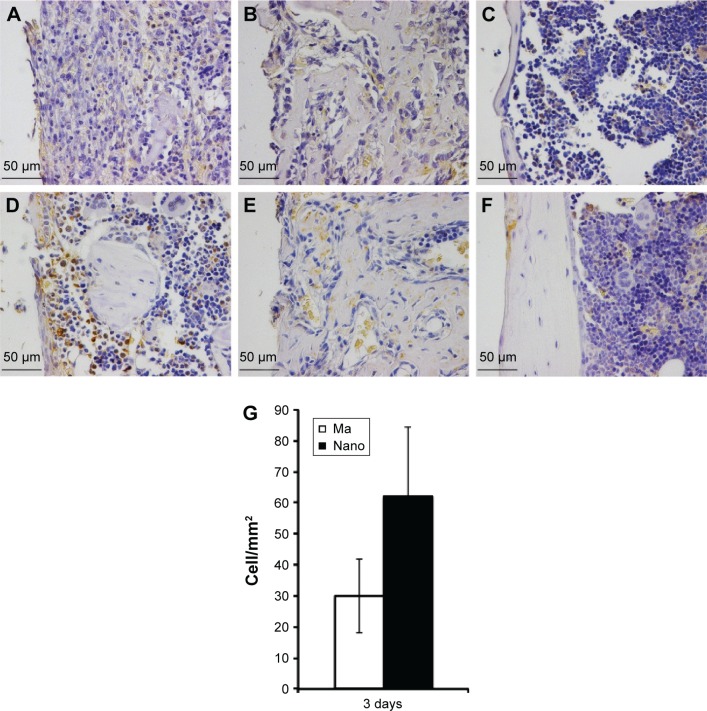
Immunohistochemical analysis of periostin-positive cells and extracellular protein.
Notes: The sections show the positively stained cells at Ma (A–C) and Nano (D–F) implants. The analysis was performed at 3 days (A and D), 6 days (B and E), and 28 days (C and F). At 3 days, the implants with nanostructures showed a relatively higher degree of periostin staining both within the cells and in the extracellular matrix (A versus D). At 6 and 28 days, the staining became more diffuse and sparse in the extracellular space with no apparent differences between the two implant types. The column graph (G) shows the quantification of periostin-positively stained cells counted along the interface, extending 200 µm from the implant surface, and expressed as number of cells/mm2. The quantification was only performed on the 3-day sections (n=3), where well-preserved sections were used, showing an intact entire interface, at both sides of the implant.
Abbreviations: Ma, machined; Nano, nanopatterned.

