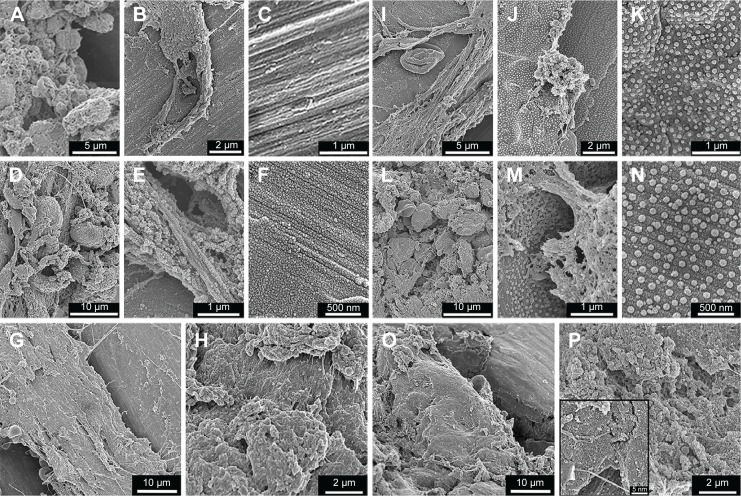
Figure 6.
SEM analysis of retrieved implants.
Notes: The SEM survey micrographs show the Ma (A–H) and Nano (I–P) implants after 3 days (upper panel), 6 days (middle panel), and 28 days (bottom panel) of implantation. At 3 days, the retrieved implants appeared partially covered with fibrinous material, which was entrapped with numerous erythrocytes and leukocytes (B for Ma and I for Nano implants). The higher magnification at this time point shows cells extending filopodia on the surfaces (A for Ma and J for Nano implants), which, in many occasions, appeared to interact with nanostructures (J). (C) and (K) show exposed areas of the implants, where the Ma (C) and Nano (K) surfaces can be observed. After 6 days, the relative proportion of the cellular material adherent to either implant type has increased (D for Ma and L for Nano implants). Yet, at this time point, some areas are exposed which reveal the underlying Ma (E) and Nano (M) implant surfaces. The higher magnifications of the Ma (F) and Nano (N) surfaces show a relative increase in the adsorbed protein layer, but still the characteristic morphology of the Ma and Nano surfaces can be observed. After 28 days, the adherent material was bone-like tissue observed at several locations of the retrieved Ma (G, H) and Nano (O, P) implants. At some locations where the implant was denuded from the adherent tissue, the Nano implant surface can be observed (insert in P).
Abbreviations: SEM, scanning electron microscopy; Ma, machined; Nano, nanopatterned.

