Figure 7.
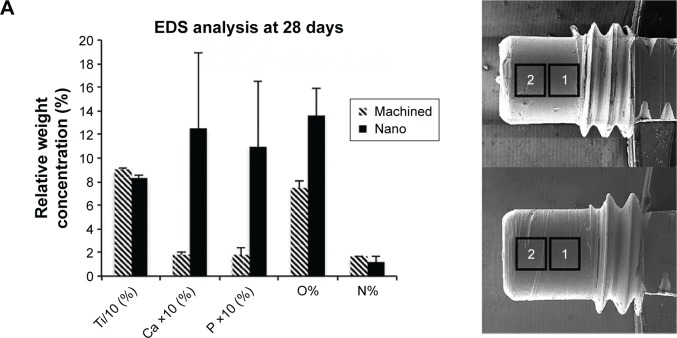
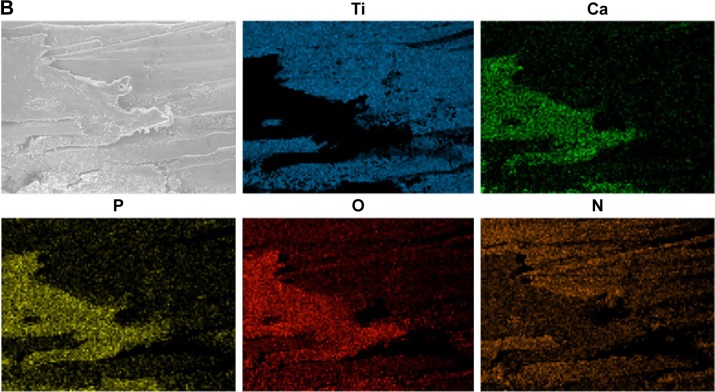
Scanning electron microscopy and EDS analyses of retrieved implants after 28 days.
Notes: The areas denoted by 1 and 2 are the sites for EDS analysis (A). The column graph (in A) shows the relative concentrations of Ti, Ca, P, O, and N (n=2–3). In the column graph (A) the plotted Ti concentration is 10 times reduced (Ti/10), while Ca and P concentrations are 10 times enhanced (Ca ×10 and P ×10). The micrographs show the distribution of Ti, Ca, P, O, and N on a Nano surface (B).
Abbreviations: EDS, energy dispersive X-ray spectroscopy; Nano, nanopatterned.


