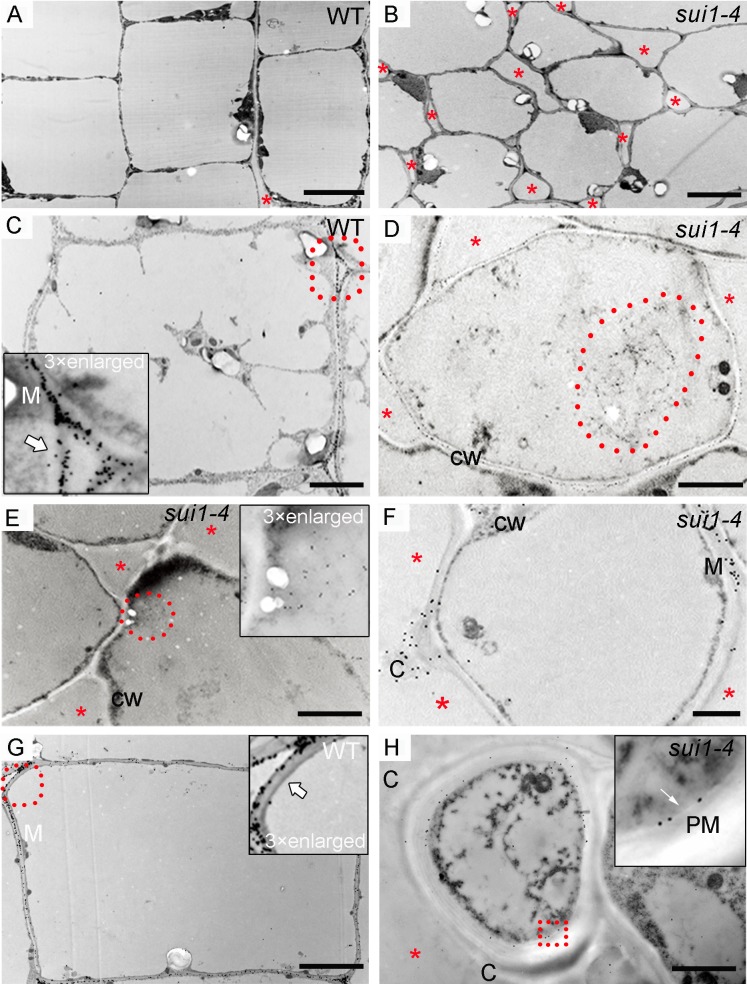
Fig 2. Pectin localization in the uppermost internode parenchymal cells of WT plants and sui1-4 plants.
(A) and (B) Transmission electron micrographs of parenchyma cell walls in the uppermost internode of WT (A) and sui1-4 (B) plants. Note the non-elongated and loosely organized parenchymal cells (B) of the uppermost internode of the mutant compared to the well-developed cells in WT (A). Scale bars: 5 μm. In all panels, red asterisks denote intercellular spaces. (C) JIM7 signals scattered around the periphery of the intercellular space (white arrow) and concentrated toward the middle lamella (M) in WT plants. Inset: magnification of the area highlighted with a red dotted circle. Scale bar: 2 μm. (D) and (E) JIM7-tagged pectin clumps (red dotted circle) inside the cytoplasm. Inset in (E): magnification of selected pectin clumps. CW: cell wall. Scale bar: 2 μm. (F) JIM7 signal distributed in the middle lamella and in a clump (C) in a sui1-4 plant. Scale bar: 2 μm. (G) JIM7-tagged pectin distributed in the middle lamella (M) and periphery of intercellular spaces (white arrow) in WT plants. Inset: magnification of the area highlighted with a red dotted circle. Scale bar: 2 μm. (H) As a negative control, clump could not been labeled by anti-PIP1s antibody which was predominantly present in the plasma membrane (white arrow). Inset in (H): magnification of selected red rectangle. PM: plasma membrane. Scale bar: 2 μm.

