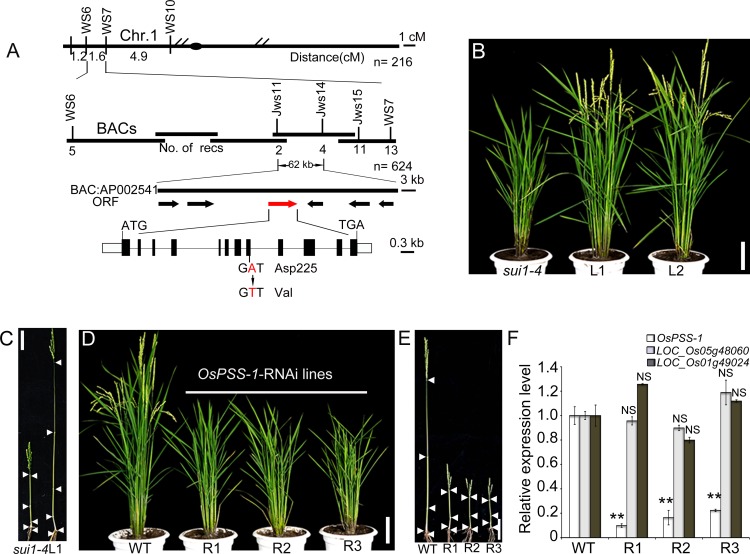
Fig 4. Positional cloning of OsPSS-1.
(A) Fine mapping of the OsPSS-1 locus. Molecular markers and number of recombinants (recs) are shown. BAC, bacterial artificial chromosome; ORF, open reading frame. (B) and (C) The WT genomic segment of OsPSS-1 completely rescues plant stature. L1 and L2 denote plants from T1 transgenic lines. In (C), the nodes of the sui1-4 mutant and L1 plants are indicated with white arrowheads. Scale bars: 10 cm. (D) OsPSS-1-RNAi transgenic lines mimic the phenotype of sui1-4 plants. R1, R2, and R3 represent three independent T1 transgenic lines. Scale bar: 10 cm. (E) Internodes in WT, R1, R2, and R3 plants; white arrowheads indicate the nodes. Scale bar: 10 cm. (F) qRT-PCR reveals lower OsPSS-1 expression in mutant plants than in WT plants, but transcript levels of OsPSS-1 homologs (LOC_Os05g48060 and LOC_Os01g49024) were not affected. Values are means ± standard error of three independent experiments. Significant differences were identified with Student’s t-test (**p<0.01); NS, not significant.

