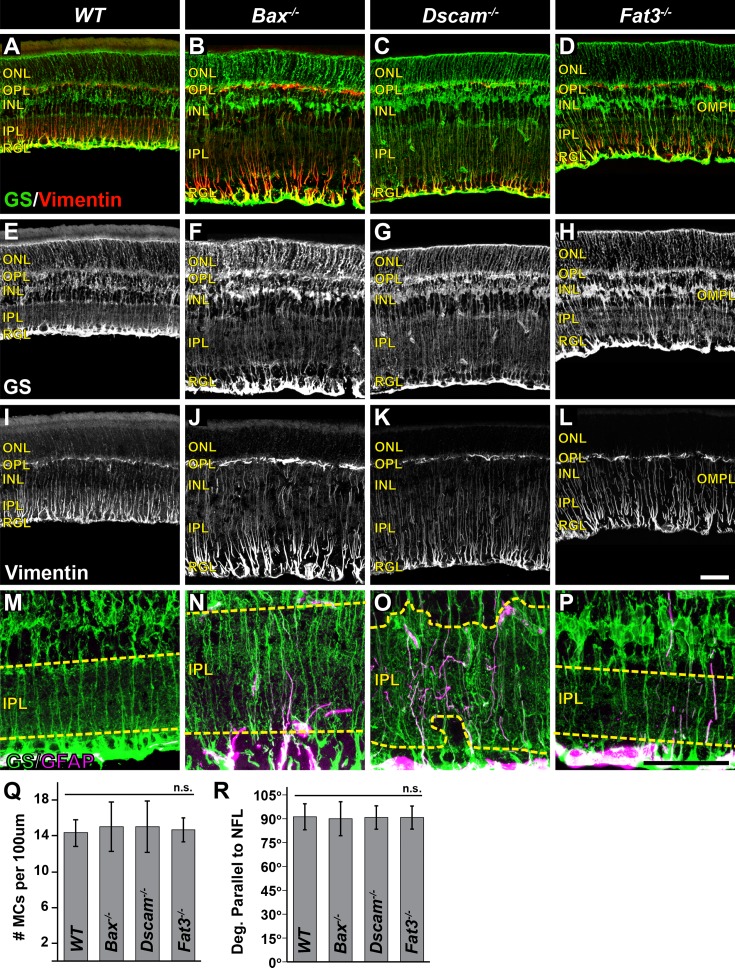
Figure 7.
Müller cells in mutant strains. (A–L) Postnatal day 28 retina sections stained with GS and vimentin. (M–P) High-magnification images of GS and GFAP staining within the IPL. Yellow dashed line outlines the boundary of the IPL. (Q) Graph illustrating MC density. No significant difference in cell number was detected. (R) Graph illustrating measurement of MC radial process projections. n ≥ 3 mice was used for each strain per quantification. Error bars: SD. A 1-way ANOVA was used to statistically analyze the data separately (MC density: P = 0.88; MC radial process: P = 0.27). Scale bars: (L, P) 50 μm.

