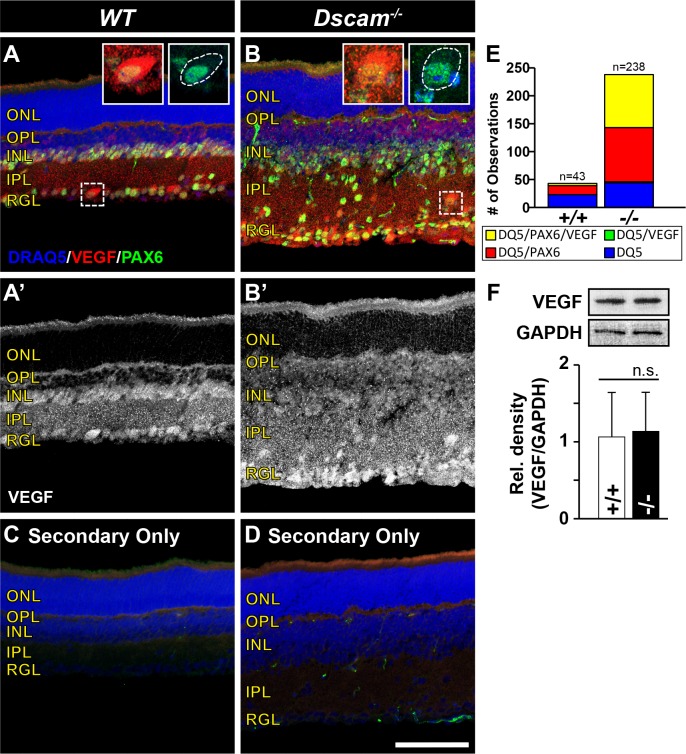
Figure 11.
Vascular endothelial growth factor localization is influenced by neural placement. Retinas were prepared for immunohistochemistry at P14 comparing Dscam−/− with littermate controls. (A, B) Retina sections stained with DRAQ5, VEGF, and PAX6. Insets illustrate the accumulation of VEGF on the surface of neurons. White dotted line in the second inset shows the outline of neuron soma. (A'–B') Vascular endothelial growth factor channel split out for better visualization. (C, D) Control retinas stained with secondary antibodies only. Staining of VEGF and PAX6 is absent. α-Mouse staining can be seen in blood vessels. (E) Graph illustrating the raw cell counts of nuclei within the IPL of WT and Dscam−/− retinas. Nuclei were sorted into four bins (yellow = DRAQ5/PAX6/VEGF; green = DRAQ5/VEGF; red = DRAQ5/PAX6; blue = DRAQ5). All cells VEGF+ were PAX6+, but not all PAX6+ cells were VEGF+. (F) Western blot was performed to quantify the total amount of VEGF protein in Dscam−/− retinas compared with littermate controls. No significant difference was detected when comparing the relative density (VEGF/GAPDH) of VEGF protein in Dscam−/− and WT littermate controls. Error bars: SD. Student's t-test was used to analyze data (P = 0.83). n ≥ 3 mice was used for each strain per quantification. DQ5, DRAQ5. Scale bar: (D) 100 μm. (A, B inset), 31 × 31 μm.

