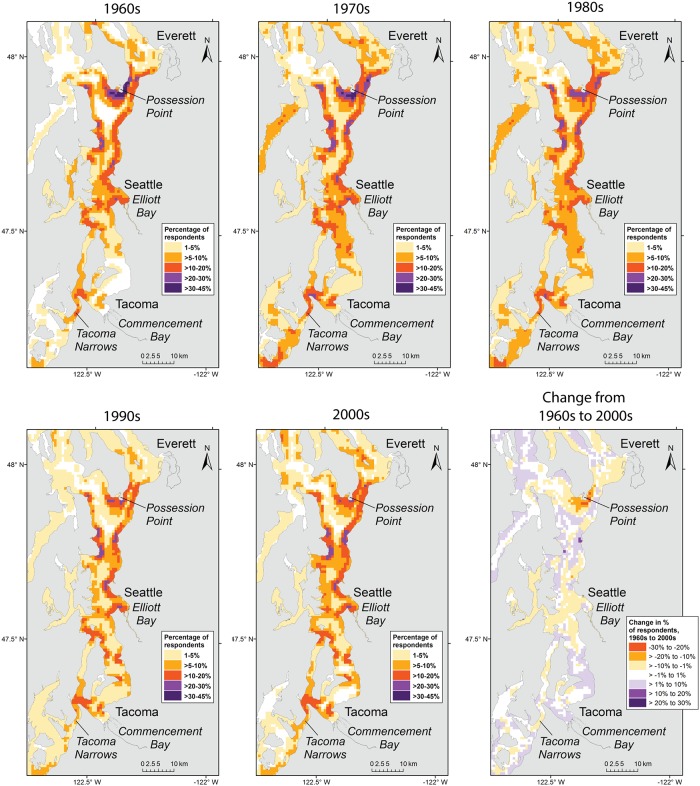
Fig 3. Spatial distribution of recreational fishing for salmon, rockfishes, flatfishes, and crabs in central Puget Sound.
Maps for individual decades are shown, from the 1960s to the 2000s. The intensity of space use by fishers is represented as the percentage of respondents who fished in each 0.8 x 0.8 km grid cell. The lower right panel shows the change in percentage of respondents from the 1960s to the 2000s. Positive values indicate that the percentage of respondents fishing in an area was higher in the 2000s than the 1960s.

