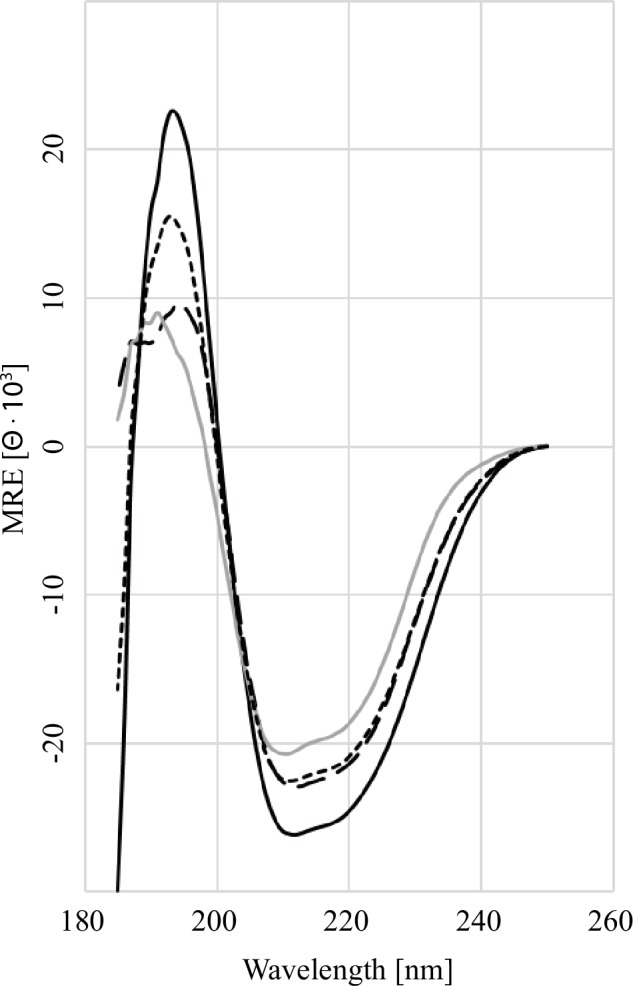
Fig 7. Far UV CD-Spectroscopy of GARP and TGFβ.

The far-UV spectra (25°C, 260–185 nm) for the following samples are as indicated: GARPTS alone (black solid line), latent TGFβ alone (grey solid line), summed spectrum of GARPTS and latent TGFβ (short-dashed line), measured spectra of the GARPTS and latent TGFβ complex (long dashed line). The decrease in the mean relative ellipticity below 200 nm between the calculated and measured spectra of the complex formation of GARPTS and TGFβ indicates a conformational change in GARP.
