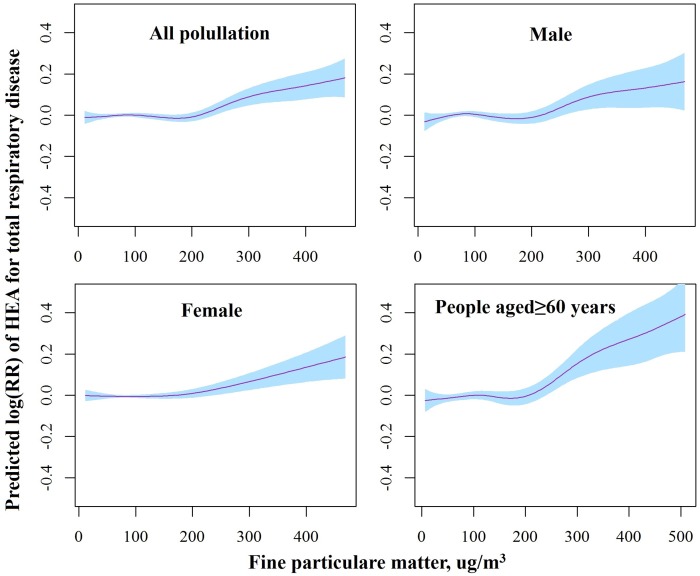
Fig 3. The smoothed exposure-response curves of daily average PM2.5 concentrations at lag0-1 against the risk of total respiratory ERV in different subgroups.
Note: The X-axis shows the moving averages of PM2.5 concentrations at lag0-1 (μg/m3). The Y-axis is the predicted log relative risk (RR). The pink line represents central estimates, and the blue shaded area represents the 95% CI.

