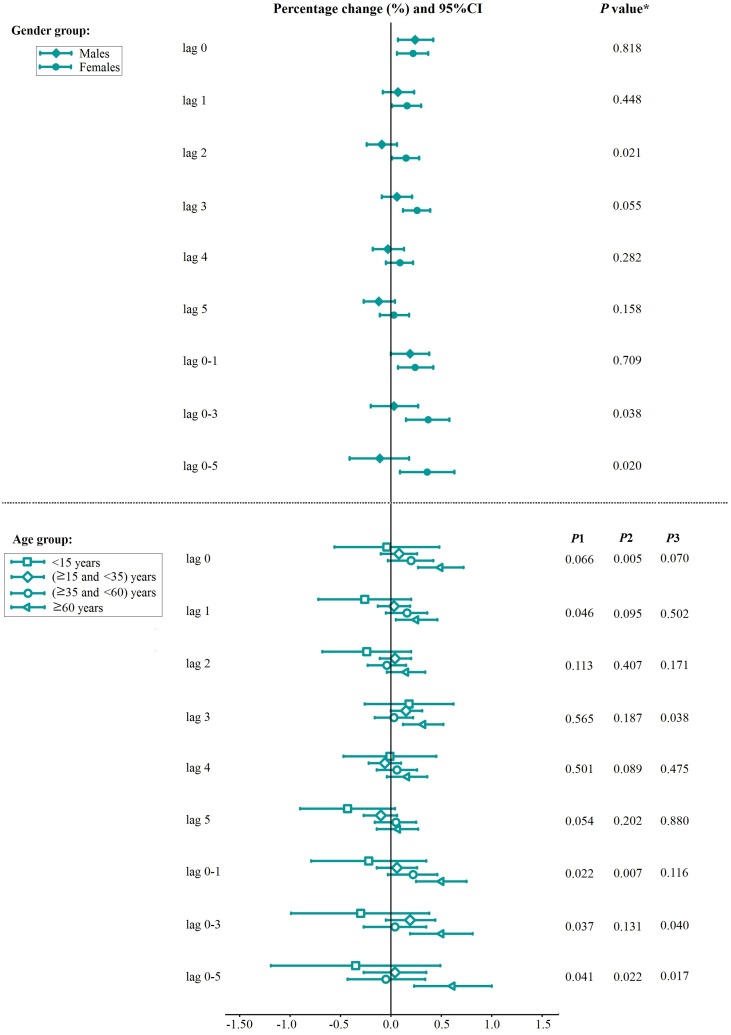
Fig 5. Percentage change with 95%CI in total respiratory ERV associated with a 10 μg/m3 increase in PM2.5 concentrations by gender and age.
Note: The P Value obtained from the Z-test for the difference between the two relative risks derived from the subgroup analysis. P1: 60 years of age and older vs the age group younger than 15 years; P2: 60 years of age and older vs the age group 15 years of age and older and younger than 35 years; P3: age 60 years of age and older vs the age group 35 years of age and older and younger than 60 years.

