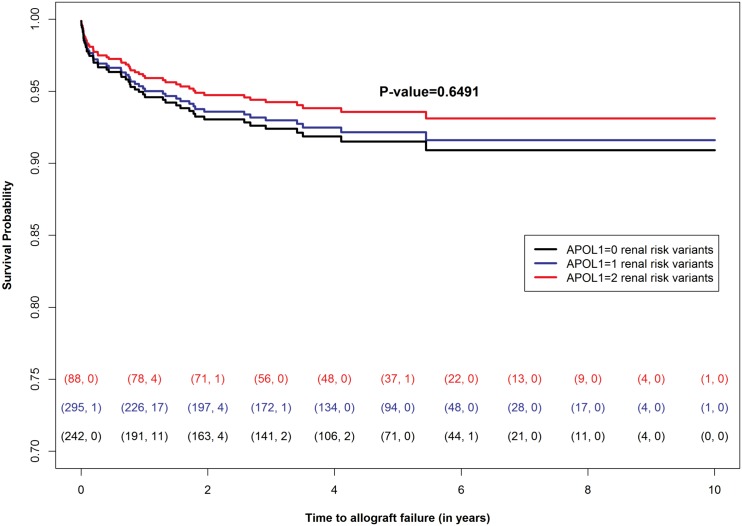
Fig 1. Allograft Survival Time with 0, 1, or 2 APOL1 Renal Risk Variants in Donor Liver.
The number of censored events is the difference between the number of transplantations that started the year and the number of events observed during the year. These numbers are shown in parentheses at the bottom of the plot; each color corresponds to a specific APOL1 risk group. With a P-value of 0.6491 there is little correlation between liver allograft survival and the APOL1 renal risk variants. P-value is from the fully adjusted Cox proportional model.

