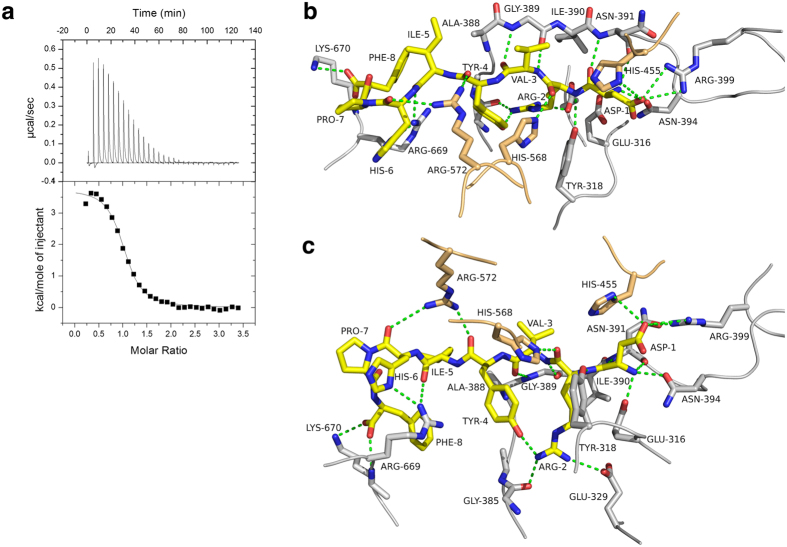
Figure 3. Binding of angiotensin-II to hDPP III.
(a) Isothermal titration calorimetry thermogram of the titration of angiotensin-II into a solution of the inactive hDPP III E451A-variant. The solid curve represents the best fit using a “one-binding-site” model yielding the following thermodynamic parameters: Kd = 1.64 ± 0.12 μM, ΔH = 15.25 ± 0.17 kJ/mol, ΔG = −32.93 ± 0.12 kJ/mol, TΔS = 48.18 ± 0.24 kJ/mol. (b,c) Two different views (related by an about 90° rotation around the horizontal axis) of the Interactions of angiotensin-II with hDPP III. The bound peptide is shown in yellow. Amino acid residues from the upper and lower lobe of the enzyme are shown in orange and grey, respectively. Dashed lines represent potential hydrogen bonding interactions. Panels (b,c) were prepared using the program PyMol (http://www.pymol.org/).

