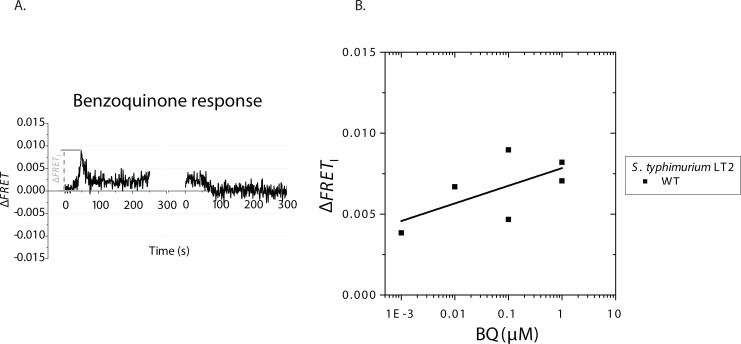
Fig 3. Repellent response to BQ of S. typhimurium LT2.
(A) Typical time series of addition (left) and removal (right) of BQ (0.1 μM) in WT S. typhimurium LT2. BQ is added and removed at times 0. (B) Initial amplitudes of the FRET response (ΔFRETI) to BQ of WT S. typhimurium are plotted as a function of the BQ concentration.

