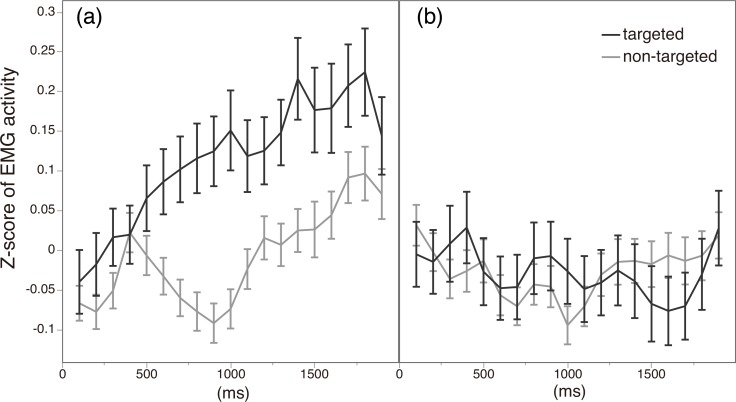
Fig 4.
Time course of EMG activity of targeted and non-targeted muscles from morphing onset in (a) the Emotion-Inference condition and (b) the Passive condition. The horizontal axis shows time elapsed from morphing onset (in milliseconds), and the vertical axis shows z-score of EMG amplitude for each muscle type. Error bars represent standard error of the mean at each time point.

