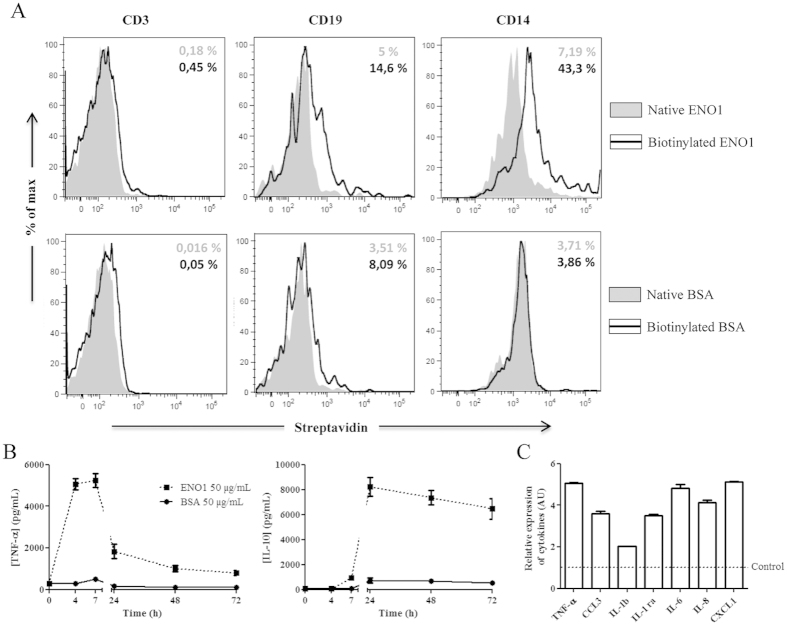
Figure 3. ENO1 binds to monocytes and exhibits a pro- and anti-inflammatory effect.
To identify cellular targets of ENO1, native and biotinylated ENO1 (50 μg/mL) or native and biotinylated BSA (50 μg/mL) were cultured with PBMC from healthy donors for 24 hours. Filled plot corresponds to native proteins and black line corresponds to biotinylated proteins. Expression levels of streptavidin on cell surface were determined by flow cytometry on T cells, B cells and monocytes, using CD3, CD19 and CD14 labelling respectively. One representative result of three independent experiments is presented. The percentage in grey corresponds to streptavidin positive cells of native protein experiments. The percentage in black corresponds to streptavidin positive cells of biotinylated proteins experiments (A). After negative selection of PBMC from healthy donors, 1.106 monocytes were cultured with ENO1 (50 μg/mL) or BSA (50μg/mL). Supernatants were removed at different times (H0, H4, H7, H24, H48, and H72) and TNF-α and IL-10 production was measured by ELISA. Data are expressed as mean ± SEM (n = 3) (B). Monocytes were stimulated with ENO1 (50 μg/mL) or control BSA (50 μg/mL) for seven hours. Supernatants were removed and the level of 36 cytokines and chemokines was measured using proteome profiler approach. The histogram represents rates of cytokines (TNF-α, IL-1β and IL-6) and chemokines (CCL3, IL-8, CXCL1) which are at least 2-fold that of the BSA control (dotted line). Data are expressed as mean ± SEM (n = 2) (C).

