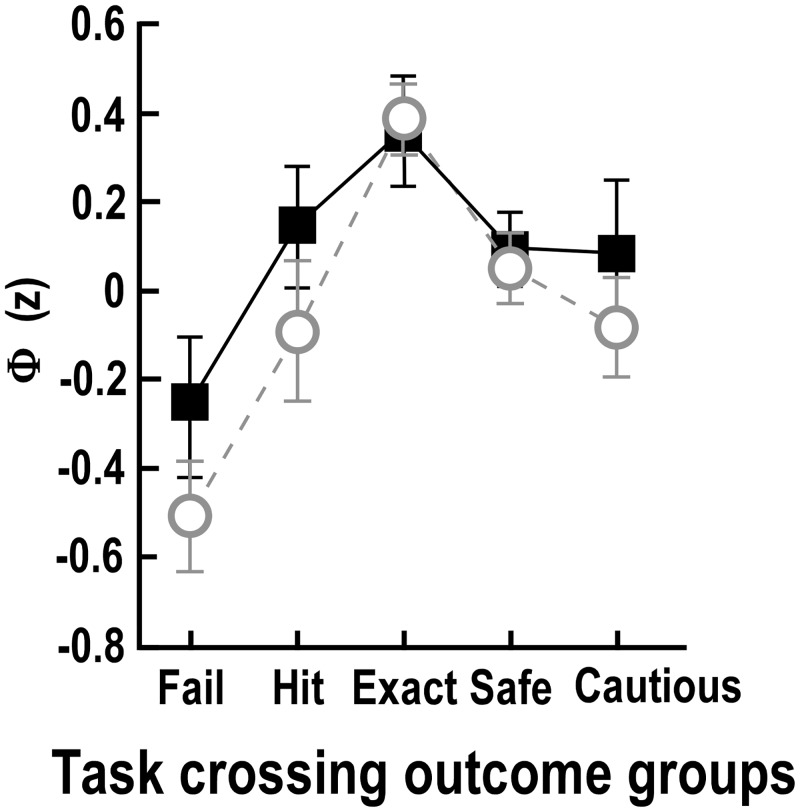
Fig 7. Everyday risk-taking scale scores by crossing outcome group.
A. Scores on the Everyday risk-taking scale are plotted as filled squares for the five task-crossing outcome groups. A more positive score reflects more daring behaviour. Open grey circles show averaged normalised performances on tests of physical and cognitive function (reproduced from Fig 6X). A more positive score reflects better function. Scores are presented as means (z units ± SEM).

