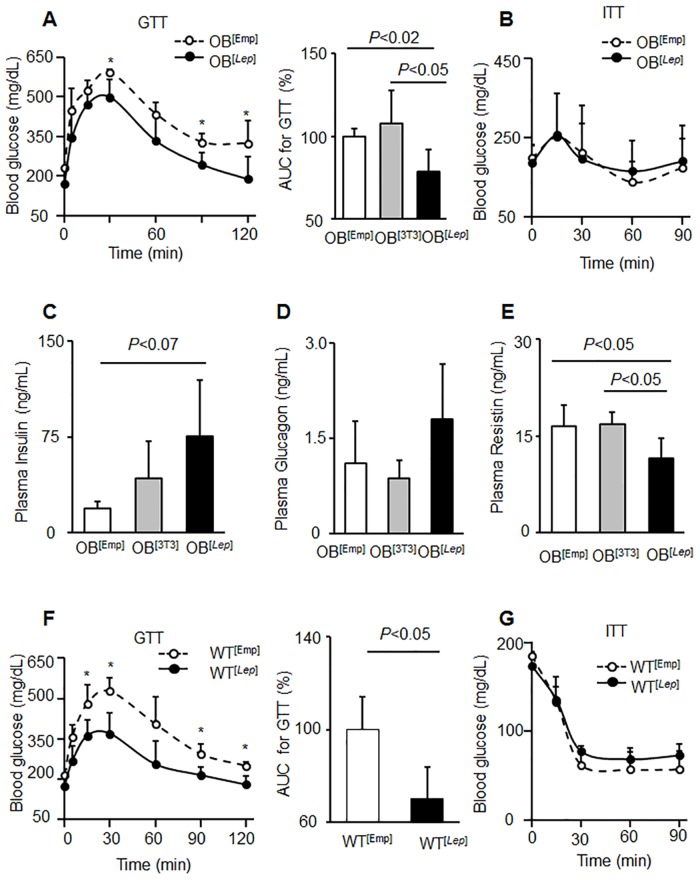
Fig 5. Leptin improves glucose tolerance and reduces resistin.
(A,B) Glucose tolerance tests (GTT) (A) or insulin tolerance tests (ITT) (B) were performed in fasting overnight mice OB[Emp] (open circles, n = 5) and OB[Lep] (filled circles, n = 5). GTT and ITT tests for OB[3T3] group are shown in S4 Fig. Average blood glucose (mg/dL) concentrations are displayed for each time point. Asterisks indicate significant differences P<0.05, Student’s t-test. The area under the curve (AUC) for each GTT was calculated using a trapezoidal approximation and displayed as percent of the control OB[Emp] group (100%). (C-E) Plasma insulin (C), glucagon (D), and resistin (E) concentrations were measured by ELISA in OB[Emp] (white bar, n = 4), OB[3T3] (gray bar, n = 3), and OB[Lep] (black bar, n = 7). Statistical difference was examined by one-way ANOVA followed by Tukey’s post hoc test. (F, G) WT mice with diet-induced obesity (Study 2) were injected with encapsulated acellular capsules (WT[Emp]) and encapsulated 3T3Lep (WT[Lep]) in both visceral fat pads (total 0.6*106 adipocytes for each cell type). GTT (F) or ITT (G) were performed in fasting overnight mice WT[Emp] (open circles, n = 3) and WT[Lep] (filled circles, n = 5). All data are represented as mean ± SD.

