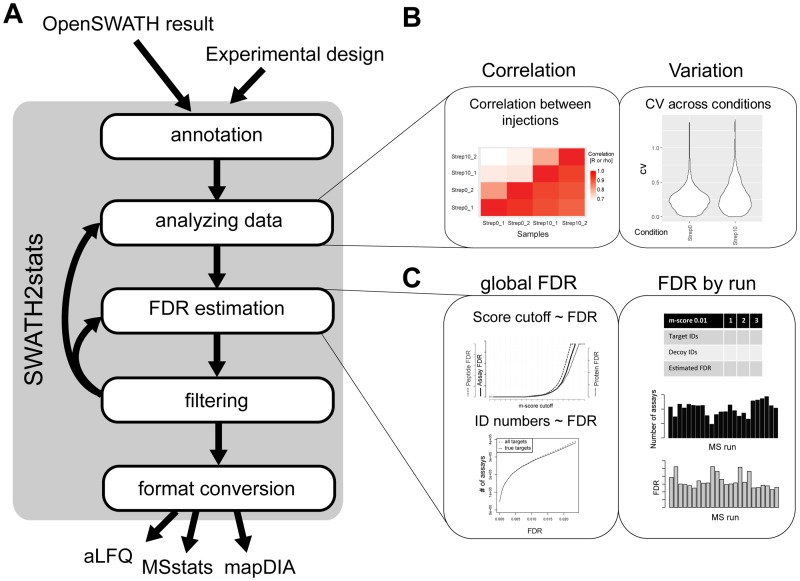
Fig 1. Overview of the R/Bioconductor package SWATH2stats.
(A) SWATH2stats uses the OpenSWATH results or results from similar software. The information on the experimental design for annotation of the conditions and replicates can be provided separately or extracted from the OpenSWATH data. The data is processed along 5 different steps (annotation, analyzing the data, false discovery rate (FDR) estimation, filtering, format conversion) using different functions (Table 1) until the data can be directly exported in a suitable format for the downstream analysis tools aLFQ, MSstats, and mapDIA. (B) Shown are example plots from the package that show the correlation of signals between injections or the coefficient of variation (cv) across conditions. (C) Shown are example plots on how the estimated global FDR or FDR by run changes depending on different score criteria.

