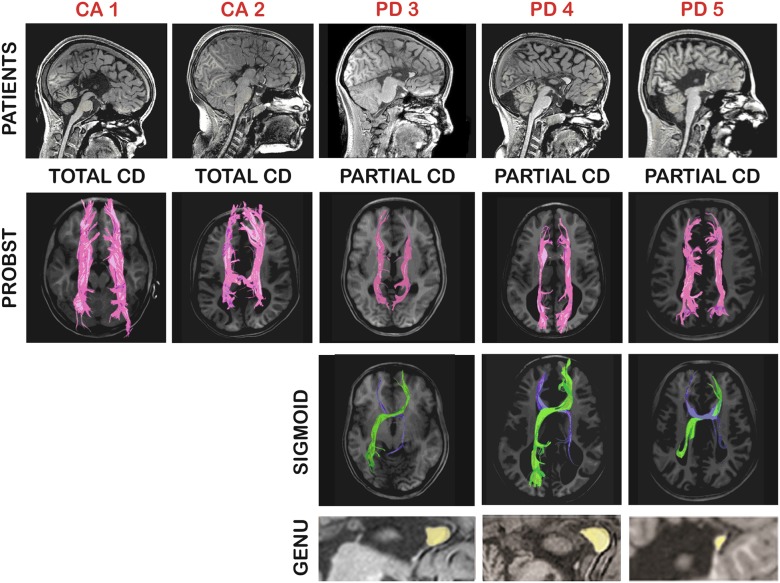
Fig 1. Summary of patients’ morphological characteristics.
Each patient is identified by red letters (CA = callosal agenesis; PD = partial dysgenesis). Upper row, T1 sagittal images of patients. Middle rows, DTI tractography of the Probst (in purple) and the sigmoid (in green and blue) bundles. Lower row, amplified sagittal view to show the callosal remnants (in yellow) at genual topography (notice smaller dimension in PD 5).

