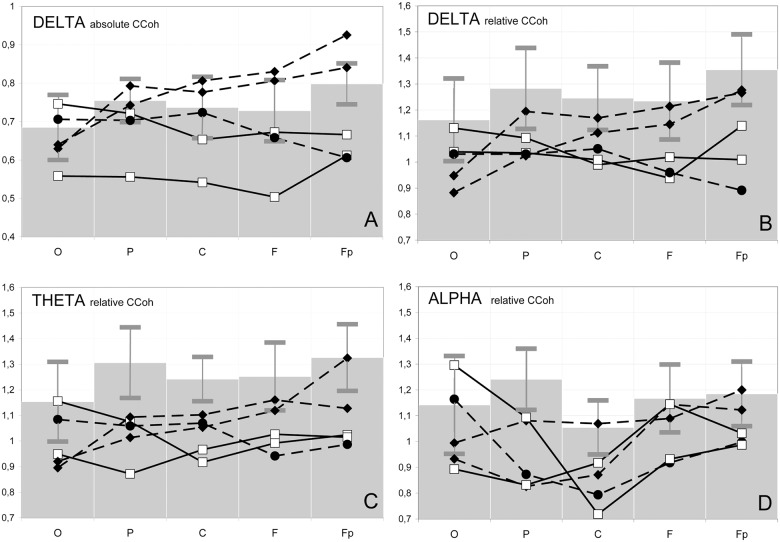
Fig 2. Electrophysiological correlates of interhemispheric communication.
Coefficients of coherence (CCoh) between the EEG recorded from homologous leads on the hemispheres in the occipital (O), parietal (P), central (C), frontal (F) and frontopolar (Fp) areas in three frequency bands. Absolute values of coefficients are shown in A, and relative values in B, C and D. Solid lines: patients with callosal agenesis (CA 1 and 2 –white squares). Dashed lines: patients with partial callosal dysgenesis, including two with a typical, robust genu (PD 3 and 4—black rhombs) and one with a substantially reduced genu (PD5—black circles). Gray bars on the background represent mean ± standard deviation for CCoh values of the control subjects.

