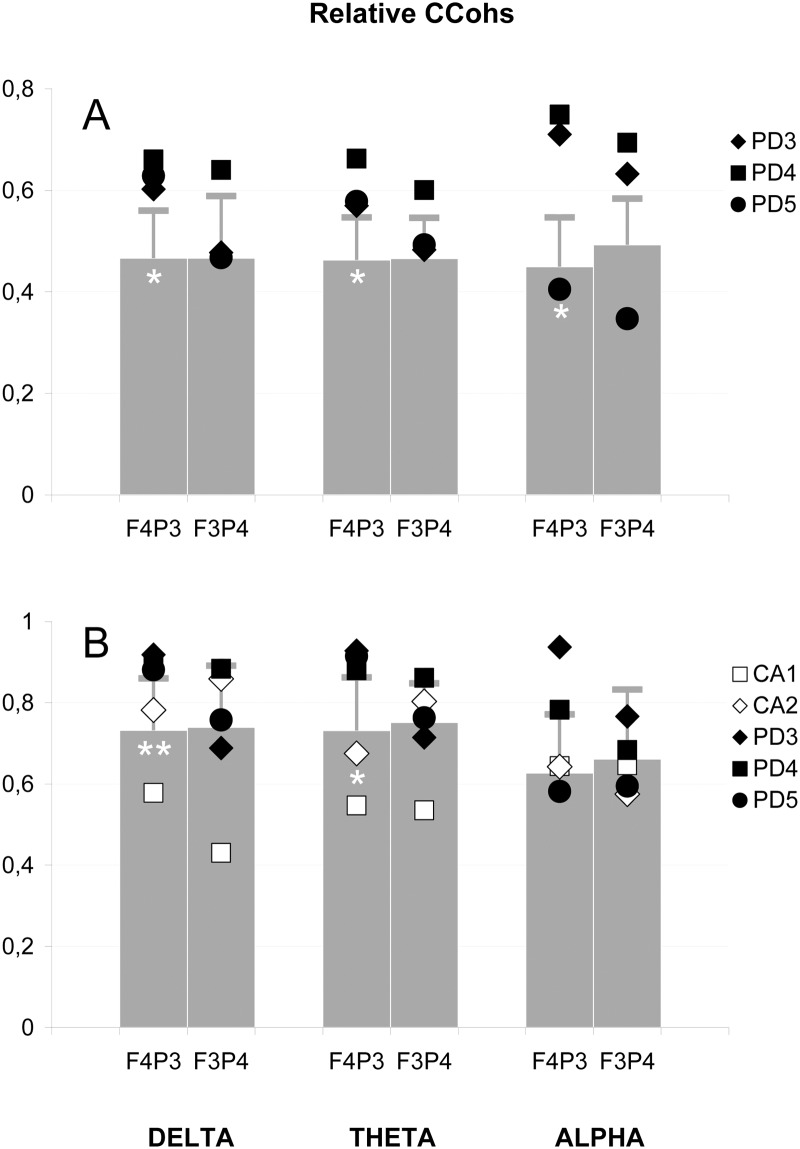
Fig 5. Electrophysiological correlates of the sigmoid bundles: Relative coefficients of coherence (CCohs).
(A) Relative values averaged for coherent connections of anterior with contralateral posterior leads (see Fig 3A). (B) Relative values for separate connection between frontal (F) and contralateral parietal (P) leads of the left (3) and right (4) hemispheres. Bars and horizontal lines represent the mean relative coefficients and standard deviations of control group; black symbols indicate the coefficients of PD patients (see Fig 3) and white symbols show the coefficients of CA patients with callosal agenesis. The number of white asterisks indicates the level of statistical significance of the difference between PD patients and control group: * p<0.05; ** p<0.01.

