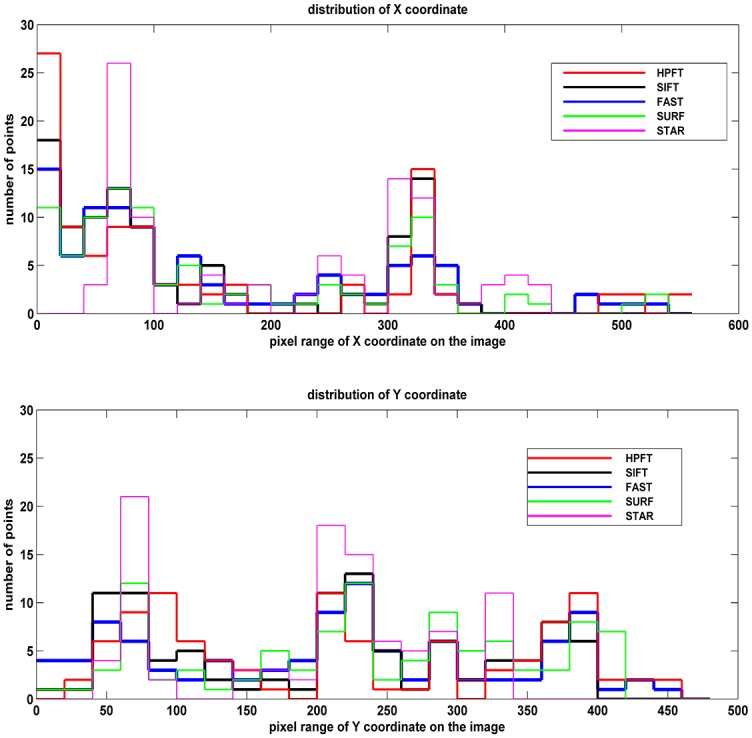
Fig 5. Initial feature distributions of X and Y coordinates.

Because the initial test feature number for all registration methods was 200, obviously, the lower squared difference value corresponded to the more uniform distribution.

Because the initial test feature number for all registration methods was 200, obviously, the lower squared difference value corresponded to the more uniform distribution.