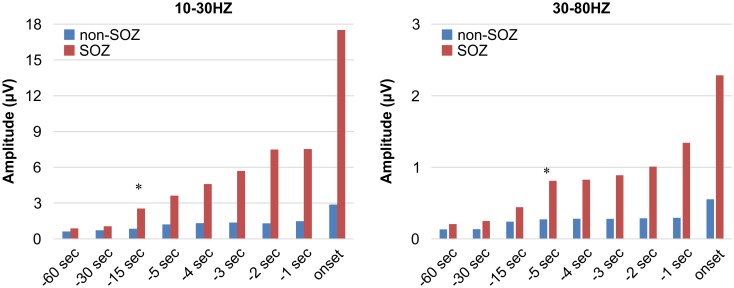
Fig 4. Statistical analysis of the frequency components in the SOZ and non-SOZ electrodes.
A statistically significant difference in power spectrogram was detected at 10–30 Hz from 15 s before seizure onset and at 30–80 Hz from 5 s before seizure onset, respectively. * represents statistical significance (p < 0.05).

