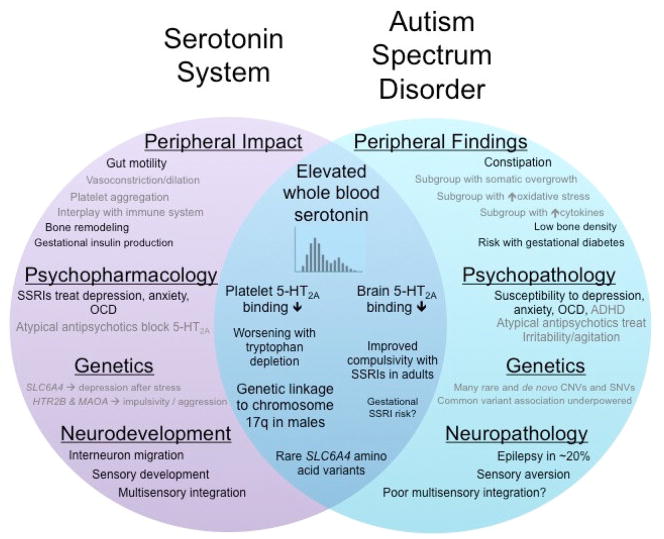
Figure 2. Venn Diagram of the Serotonin System and Autism Spectrum Disorder.
Key roles or research findings within the serotonin system are shown in the purple circle on the left. Research or clinical findings in autism spectrum disorder are depicted in the teal circle on the right. The overlapping blue region demonstrates findings directly related to serotonin in ASD. Some findings in ASD, such as constipation, overlap with known roles of the serotonin system, such as gut motility – even though they have not been directly connected – and these are shown in black type in parallel positions within the corresponding circles. Other findings, such as somatic overgrowth or regulation of vasoconstriction, so no such overlap, and these are shown in gray type.

