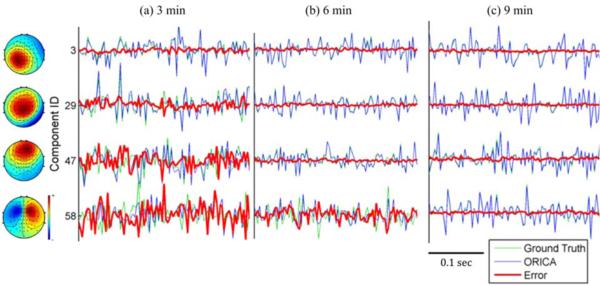
Fig. 3.
Source dynamics and the corresponding component maps of four representative components reconstructedby ORICA at (a) 3 min, (b) 6 min, or (c) 9 min of simulated mixed 64-channel stationary EEG data. Reconstructed source dynamic (blue) is superimposed on ground truth (green) with error, i.e. difference, (red). The oscillatory (autocorrelated) and burst-like source dynamics, as well as homogeneous component maps of the four depicted ICs, are characteristic of real EEG source dynamics.

