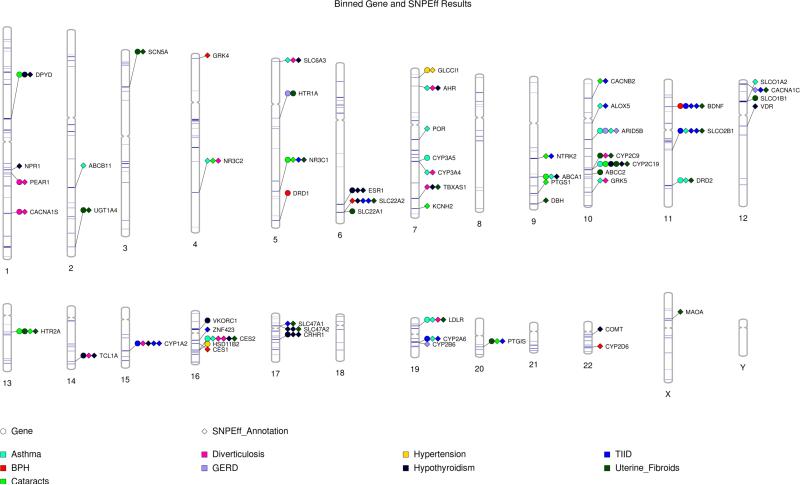
Figure 4.
Phenogram plot of significant association results (p-value<0.05) in a binned gene and SNPEff functional prediction Bin-KAT analysis. The biological features are designated with different shapes, and each phenotype is represented by a different color. The target capture of the PGRNseq platform is shown by blue horizontal bands across the chromosome. The specific SNPEff effect can be found in Supplementary Table 1.

