Figure 5.
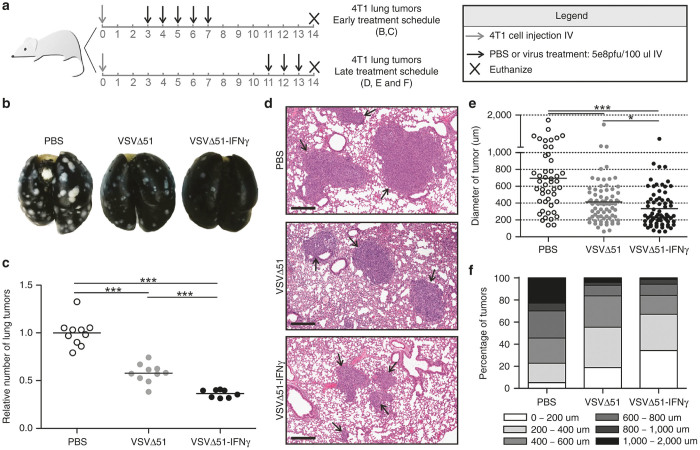
VSVΔ51-IFNγ reduces the number and size of lung tumors in the 4T1 tumor model. (a) Schematic representation of the treatment schedules used in this figure. (b) Representative pictures of lungs from mice treated with PBS, VSVΔ51 or VSVΔ51-IFNγ. Lungs were perfused with india ink to reveal the tumors (appear white). (c) Total surface lung tumor counts of all mice. (d) Representative pictures showing the average size of tumors observed in each treatment group (scale bar: 300 μm). Mice from the late treatment schedule (n = 3 or 4) were sacrificed, the lungs were fixed in formalin and paraffin embedded sections were stained with hematoxylin and eosin. (e) Graph showing the largest diameter of each tumor observed in d. (f) The results obtained in e were subdivided according to their size and represented as percentage of the tumors within the group belonging to each subdivision. *P < 0.1, ***P < 0.0001 (Mann-Whitney U-test).

