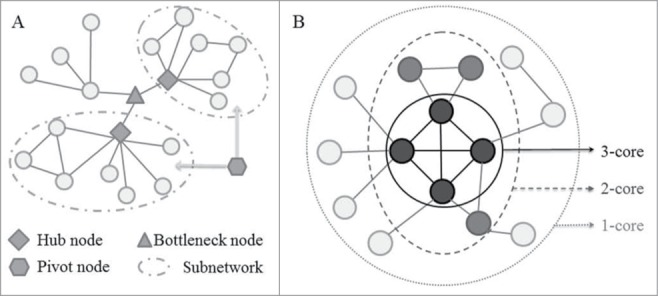
Figure 3.

Schematic diagram for network measurements used to decipher the ncRNA-mediated cell death system. (A) A schematic diagram represents one bottleneck node, 2 hub nodes and one pivot node. Hubs are highly connected to other nodes in the network and act as the center point within the modules or subnetworks. Evidence from model organisms indicates that hub proteins tend to be encoded by essential genes, and the deletion of hub nodes leads to amount of diseases. Bottlenecks are defined as proteins with a high betweenness that are central to many paths in the network, and play a key role in controlling network signaling, and also like to be essential proteins, and often function as key genes in the development of disease progression. Pivots correspond to significantly shared members of 2 different pathways or subnetworks, which potentially have a role as molecular switches between these pathways or subnetworks, and further sheds light on the organization of the cellular machinery. (B) Schematic description of the 3-core decomposition of a network. k-core is a subnetwork defined by iteratively removing the nodes with a degree lower than k and their incident links. The inner k-cores were shown to be global hubs and enriched with lethal genes, which may potentially act as the evolutionarily conserved backbone of ncRNA-mediated cell death system.
