
Figure 4.
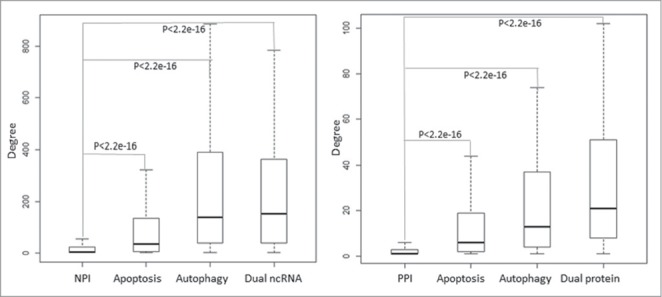
Distribution of degrees of apoptosis and autophagy-associated ncRNAs and proteins in the global human NPI and PPI network. The boxplot represents the degree distribution. The cell death-associated ncRNAs and proteins especially the dual nodes have a significantly higher degree distribution than that of the whole nodes in the NPI and PPI network.