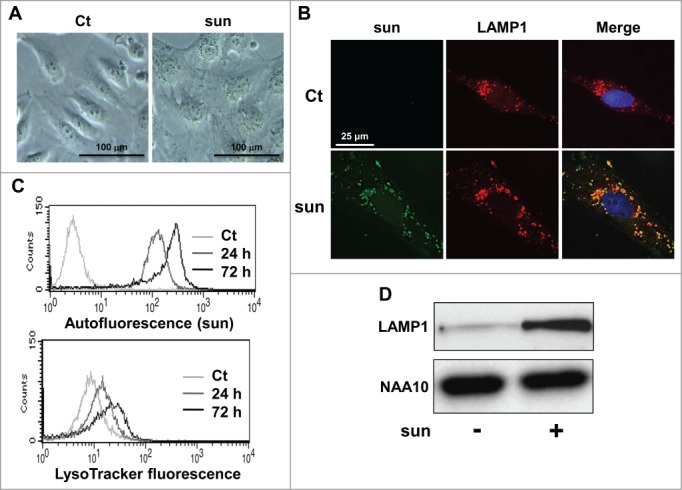
Figure 2.

Sunitinib accumulated in lysosomes. (A) Phase contrast microscopy showing modifications of the cell shape and accumulation of yellow granules in 786-O cell incubated with 2.5 μmol/L of sunitinib for 24 h. (B) Immunofluorescence to LAMP1 in control (Ct) or sunitinib-treated (2.5 μmol/L, sun) 786-O cells for 48 h. Sunitinib autofluorescence is shown. Merged fluorescence is also shown. (C) The autofluorescence of sunitinib and the fluorescence of the lysosomal probe (LysoTracker Red DND-99, Lyso) were followed by FACS analysis performed at the indicated times. (D) Cell extracts from control (-) or sunitinib-treated (2.5 μmol/L) 786-O cells incubated for 72 h were tested for LAMP1 expression by immunoblotting. NAA10 is shown as a loading control.
