Figure 6.

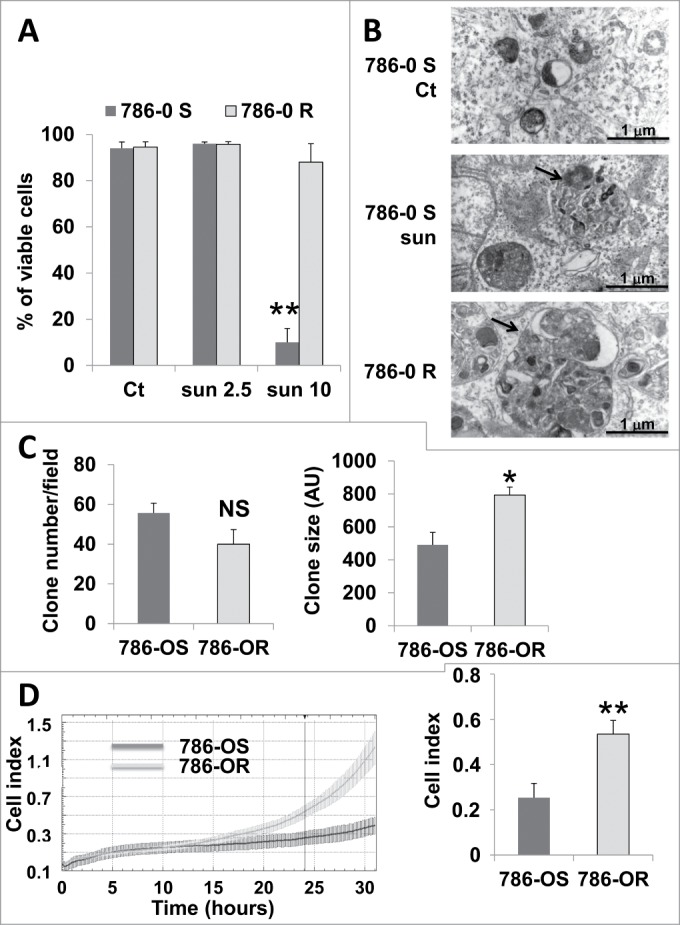
Enhanced inhibition of autophagy and aggressiveness of 786-OR cells. (A) Determination of the percentage of viable 786-OS and 786-OR cells in the absence (Ct) or presence of 2.5 (sun2.5) or 10 μmol/L (sun10) of sunitinib after incubation for 24 h. (B) Electron micrographs of 786-OS cells incubated in the absence (Ct) or presence of sunitinib 2.5 μmol/L (sun) for 48 h and of 786-OR cells showing autolysosomes (arrows). Note the presence of autolysosomes of increased size in 786-OR cells. (C) Quantification of the number (left panel) and the size (right panel) of colonies obtained for 786-OS and 786-OR cells seeded in soft agar; *, P < 0.05. (D) Cell migration in real time was analyzed with the xCELLigence RTCA. The chart shows the outcome of the kinetics analysis of the cell migration for 786-OS and 786-OR cells (left panel). The right panel shows the average cell indexes at 24 h from 3 independent experiments. **, P < 0.01.
