
Figure 1.
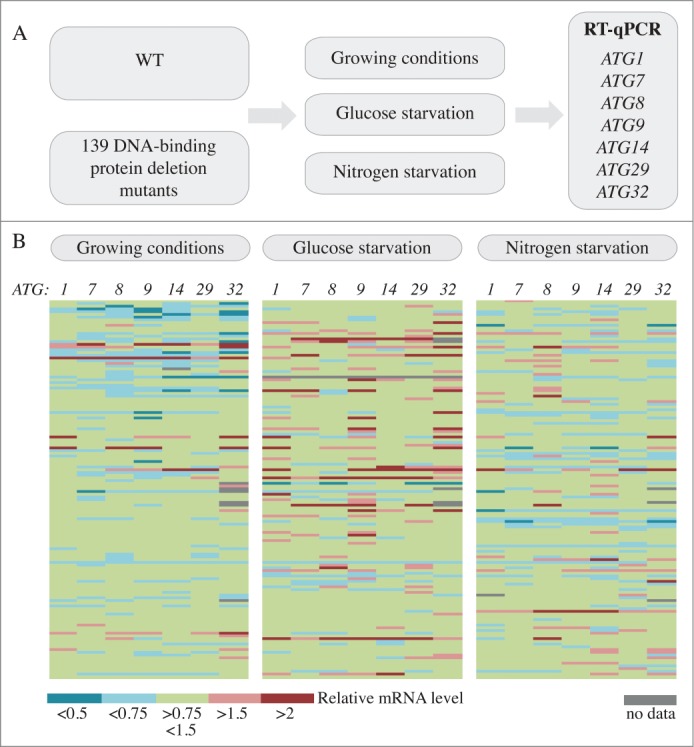
A screen for DNA-binding proteins involved in the regulation of ATG gene expression. (A) Schematic of the screen. (B) Color graph illustrating the results of the screen. Each line represents the mRNA level of an independent mutant relative to the wild type in the same condition, which was set to 1.