
Figure 4.
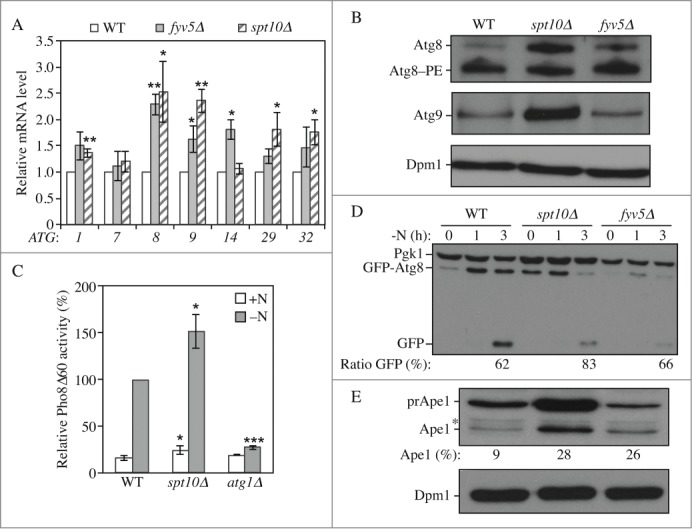
Spt10 and Fyv5 are transcriptional repressors of ATG gene expression. Wild type (WLY176), spt10Δ (YAB415), fyv5Δ (YAB414) and atg1Δ (WLY192) cells were grown in YPD (+N) until mid-log phase. (A) Spt10 and Fyv5 repress the expression of ATG genes in growing conditions. mRNA was extracted and quantified by RT-qPCR as in Figure 2. Data represent the average of at least 3 independent experiments. (B) Protein extracts were analyzed by western blot with anti-Atg8, anti-Atg9 and anti-Dpm1 (loading control) antisera and antibodies. (C-D) Autophagy is increased in spt10Δ cells. Cells were grown in YPD until mid-log phase (+N) and then starved for nitrogen (-N) for the indicated times. (C) The Pho8Δ60 activity was measured and normalized as in Figure 2 for cells that were starved for 3 h. Data represent the average of at least 3 independent experiments. (D) Cells were transformed with an integrating plasmid carrying a GFP-Atg8 construct under the control of the endogenous ATG8 promoter. Protein extracts were analyzed by western blot with anti-YFP antibody and anti-Pgk1 (loading control) antisera. The percentage of free GFP:total GFP is indicated. (E) The Cvt pathway as measured by the maturation of prApe1 is increased in spt10Δ and fyv5Δ cells. Proteins were extracted from cells grown in nutrient-rich conditions, and the extracts were analyzed by western blot with anti-Ape1 antiserum and anti-Dpm1 (loading control) antibody. prApe1, precursor form; Ape1, mature form. The percentage of Ape1:total Ape1 is indicated. *, Nonspecific band.