
Figure 2 (See previous page).
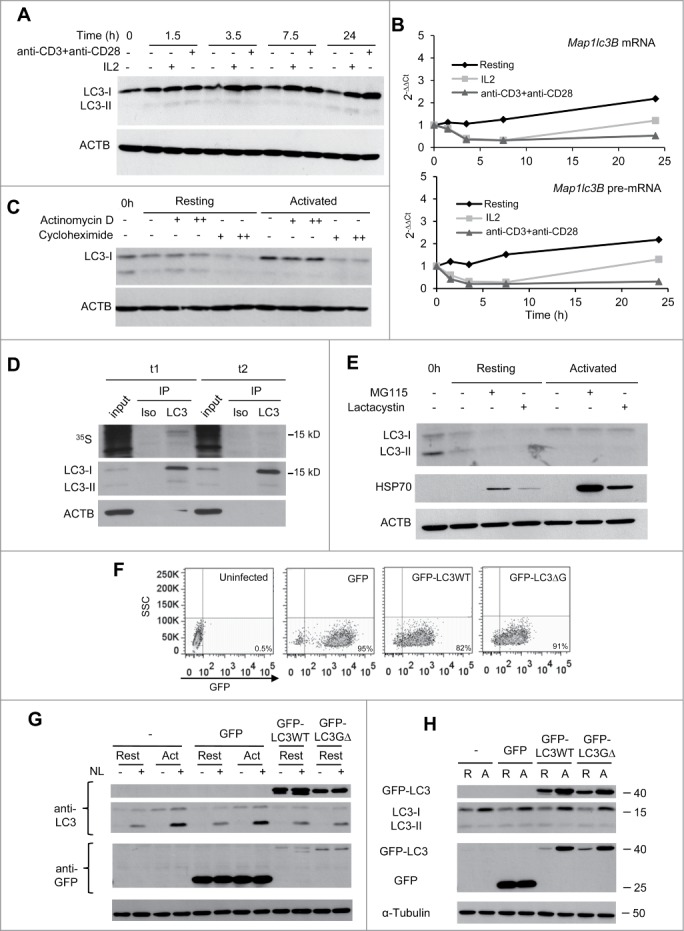
LC3 is post-transcriptionally upregulated following TCR and CD28 engagement in Th1 cells. TH1 cells were incubated with media alone or stimulated with either IL2 or plate-bound anti-CD3 and soluble anti-CD28 antibodies. Cells were harvested at indicated times after stimulation and samples were processed for protein and RNA analysis. (A) LC3 expression was analyzed by immunoblot on whole cell protein extracts and (B) Lc3b mRNA and pre-mRNA were quantified by real-time PCR. Graphs show one representative kinetic of RNA quantification out of 4 independent experiments with similar results analyzing RNA levels at different time points from 30 min to 24 h poststimulation. (C) TH1 cells were left resting or activated with plate-bound anti-CD3 and soluble anti-CD28 antibodies for 8 h. 0.1 µg/mL (+) or 1 µg/mL (++) of actinomycin D; or 10 µg/mL (+) or 100 µg/mL (++) of cycloheximide was added for the last 3 h. Whole protein extracts were analyzed by immunoblot to quantify LC3 expression. ACTB was used as loading control. (D) TH1 cells were activated with plate-bound anti-CD3 and soluble anti-CD28 antibodies in media without Met or Cys supplemented with 35S-Met+Cys. After 3.5 h of labeling, protein extracts were obtained from half of the cell in the culture (t1). Excess of cold Met+Cys were added to the remaining cells for 3.5 additional h (t2). Both protein extracts were immunoprecipitated (IP) with anti-LC3 antibody (LC3) or isotype control (Iso). Ten µg of input and the IP products were separated by SDS-PAGE and transferred to nitrocellulose membrane. 35S incorporation into proteins was measure by autoradiography (upper panel) and the same membrane was then immunoblotted for LC3 and ACTB (lower panels). (E) TH1 cells were incubated in media alone or activated with plate-bound anti-CD3 and soluble anti-CD28 antibodies for 7 h. Proteasome inhibitors (MG-115 10 µM or lactacystin 5 µM) were added for the last 4 h. Whole cell lysates were analyzed by immunoblot for the indicated proteins. HSP70 accumulation in the presence of proteasome inhibitors was used as a positive control. (F and G) TH1 cells were left uninfected (-) or transduced using lentiviruses containing either GFP alone or GFP-LC3 (wt or G∆) and sorted for GFP-positive cells. TH1 were then left resting or activated for 16 to 18 h, NL was added for the last 3 h. Transduction efficiency (percentage of GFP+ cells) was evaluated by FACS and expression of GFP-LC3 and autophagy flux were analyzed by immunoblot. (H) TH1 cells were obtained as described in (F), and left resting (R) or activated (A) for 16 to 18 h. Expression of endogenous and exogenous LC3 was followed using anti-LC3 and anti-GFP antibodies. TUBA/αTubulin was used as loading control in F and G because ACTB band overlapped with the size of GFP-LC3. Each blot from this figure is representative of at least 3 independent experiments.