
Figure 4.
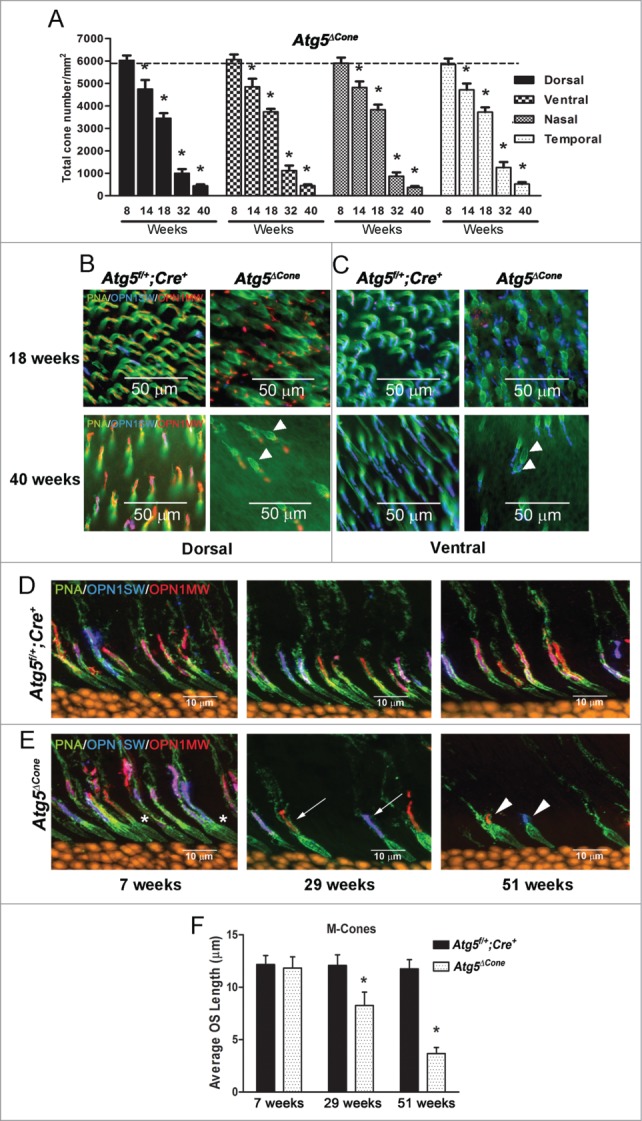
Degeneration of ATG5-deficient cones. (A) Mouse retinae from Atg5f/+;Cre+ (n = 4 for each time point) and Atg5ΔCone mice (n = 4 for each time point) were harvested at various ages and cones were enumerated following staining of retinal flat mounts for PNA (green), OPN1MW/M-opsin (red) and OPN1SW/S-opsin (blue). Data represent the mean ± standard error, * denotes statistically different (p < 0.05) from control which is represented by the dotted line (cone numbers averaged from all control mice = 5884 ± 48). (B) Representative confocal micrographs of the dorsal region of the retina from Atg5f/+;Cre+ (left panels) and Atg5ΔCone mice (right panels) taken at 18 wk (upper panels) and 40 wk (lower panels) (n = 4−6 retina examined per group). (C) Representative confocal micrographs of the ventral region of the retina from Atg5f/+;Cre+ (left panels) and Atg5ΔCone mice (right panels) taken at 18 wk (upper panels) and 40 wk (lower panels) (n = 4−6 retina examined per group). Representative confocal images of the retinae of control Atg5f/+; Cre+ (D) and Atg5ΔCone (E) mice at 7, 29, and 51 wk illustrating the loss of both M (red) and S (blue) cones in Atg5ΔCone mice. PNA (green) and nuclei (orange), n = 4−6 retina examined per group. (F) M-cone outer segment length of Atg5f/+; Cre+ and Atg5ΔCone mice at 7, 29, and 51 wk. Data represent the mean ± standard error, * denotes statistically significant from control (p < 0.05), n = 4 for each time point.