
Figure 3 (See previous page).
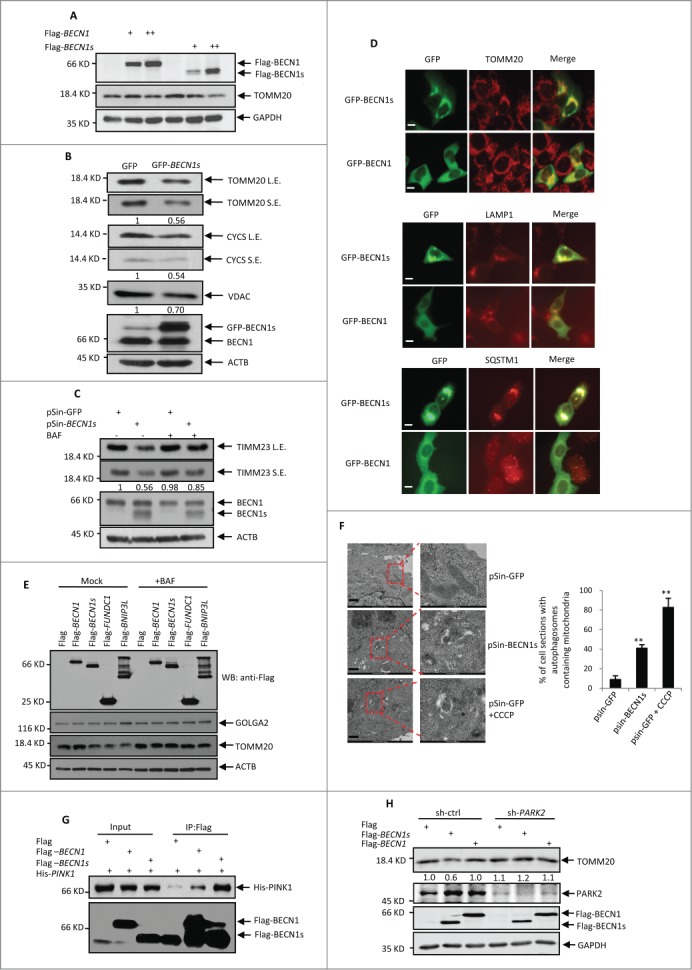
BECN1s induces mitophagy. (A) HeLa cells were transfected with the increasing amounts of constructs encoding either Flag-BECN1 or Flag-BECN1s. Twenty-four h after transfection, cell lysates were analyzed by western blot with anti-Flag, anti-TOMM20 and anti-GAPDH antibodies. (B) HeLa cells were transfected with either GFP control vector or GFP-BECN1. Twenty-four h after transfection, cell lysates were analyzed by western blot with the indicated antibodies. The blots were also qualified by using Gel-Pro analyzer software (Rockville, MD, USA). The value of each band indicates the relative expression levels of the indicated protein after normalizing to the loading control ACTIN. L.E. and SE indicate long time exposure and short time exposure, respectively. (C) HeLa cells were infected with lentiviruses expressing GFP or BECN1s. Forty-eight h after infection, cells were treated with or without BAF for another 12 h. Cell lysates were then analyzed by western blot with anti-TIMM23, anti-BECN1 and anti-ACTIN antibodies. The blot was also qualified by using Gel-Pro analyzer software (Rockville, MD, USA). The value of each band indicates the relative expression levels of TIMM23 after normalizing to the loading control ACTIN. L.E. and SE indicate long time exposure and short time exposure, respectively. (D) HeLa cells were transfected with either GFP control vector or GFP-BECN1s. Twenty-four h after transfection, cells were immunostained with anti-TOMM20, anti-LAMP1 and anti-SQSTM1 antibodies, respectively. Scale bar: 20 μm. (E) HeLa cells were transfected with the constructs encoding Flag-BECN1, Flag-BECN1s, Flag-BNIP3L and Flag-FUNDC1 as indicated. Twenty-four h after transfection, cells were treated with or without BAF for another 12 h. Cell lysates were analyzed by western blot with the indicated antibodies. (F) Cells expressing GFP or BECN1s were treated with or without Carbonyl cyanide m-chlorophenylhydrazone (CCCP) for 12 h. Cells were then subjected to electron microscopy analysis. The shown images are representatives of 3 independent experiments. Scale bar: 1 μm. The percentage of cells with autophagosomes containing mitochondria is also shown as mean±SD from 3 independent experiments. n>28 cells per experiments. **, P<0.01. (G) HEK 293T Cells were transfected with Flag-BECN1, Flag-BECN1s and His-PINK1 in the indicated combinations. Twenty-four h after transfection, cell lysates were immunoprecipitated with anti-Flag antibody, followed by western blot analysis with anti-His antibody. (H) SH-SY5Y cells expressing control shRNA or PARK2 shRNA were transfected with Flag-BECN1 or Flag-BECN1s. Forty-eight h after transfection, cell lysates were analyzed by western blot with anti-TOMM20 antibody. The blot was also qualified by using Gel-Pro analyzer software (Rockville, MD, USA). The value of each band indicates the relative expression levels of TOMM20 after normalizing to the loading control GAPDH.