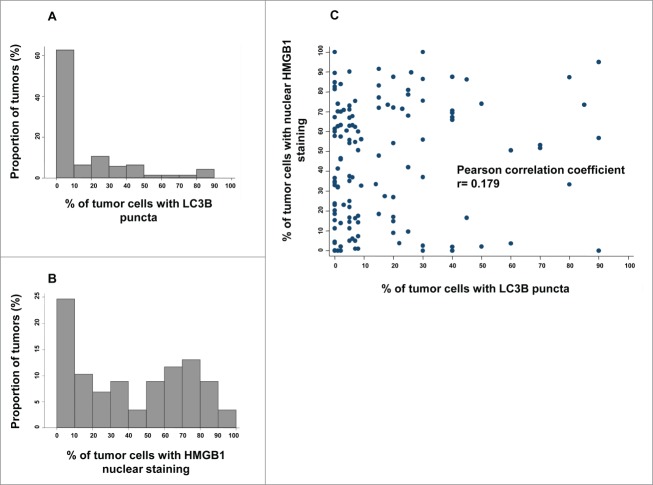
Figure 2.
LC3B and HMGB1 staining quantitative analysis in the training cohort. (A) Distribution frequencies of percent of breast cancer cells harboring LC3B cytoplasmic puncta in the training cohort. (B) Distribution frequencies of percent of breast cancer cells with HMGB1-positive nuclei in the training cohort. (C) Correlation between percent of breast cancer cells with LC3B puncta, and percent of breast cancer cells with HMGB1 nuclear staining in each sample of the training cohort.

