Figure 4.
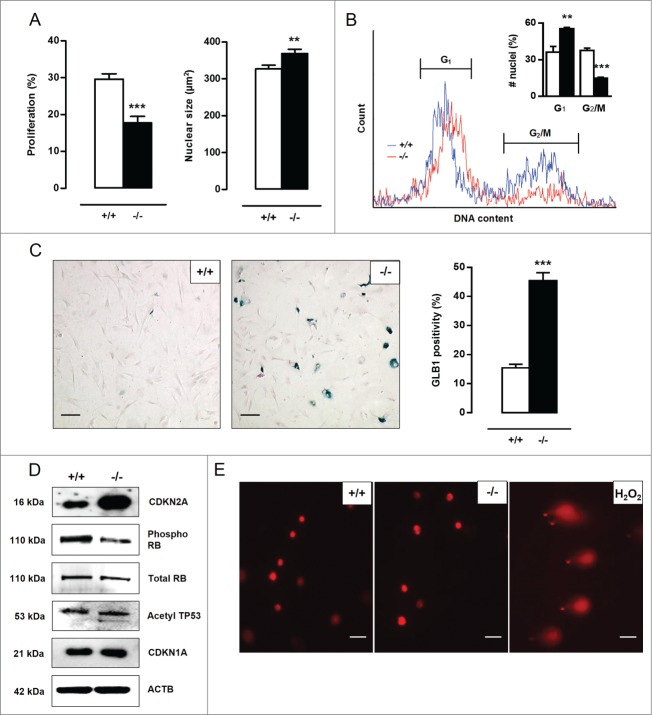
Defective autophagy in VSMCs accelerates senescence. (A) Atg7+/+Tagln-Cre+ (+/+) and Atg7F/FTagln-Cre+ (−/−) VSMCs were treated with BrdU to examine proliferation (***P < 0.001; n = 9 counting regions of 300 cells/region/condition; Student t test). The size of BrdU-positive nuclei was measured to detect nuclear hypertrophy (**, P < 0.01; n = 50 nuclei; Student t test). (B) DNA cell cycle analysis of Atg7+/+ (blue) and atg7−/− (red) VSMCs. The bar graph shows the percentage of Atg7+/+ and atg7−/− nuclei in the G1 and G2/M phase of the cell cycle (**, P < 0.01; ***, P < 0.001; Student t test). (C) Atg7+/+ and atg7−/− VSMCs were stained with X-gal mixture for 24 h, followed by Nuclear Fast Red staining. Scale bar: 125 µm. The number of senescence-associated GLB1-positive VSMCs was quantified. (***, P < 0.001; n = 2 counting regions of 200 cells/region/condition; Student t test) (D) Western blot analysis of CDKN2A, phospho RB, total RB, acetylated TP53 and CDKN1A in Atg7+/+ and atg7−/− VSMCs. (E) Detection of DNA damage in Atg7+/+ and atg7−/− VSMCs by comet assay. Atg7+/+ VSMCs treated with .5 mmol/l H2O2 for 10 min were used as positive control. Scale bar: 25 µm.

