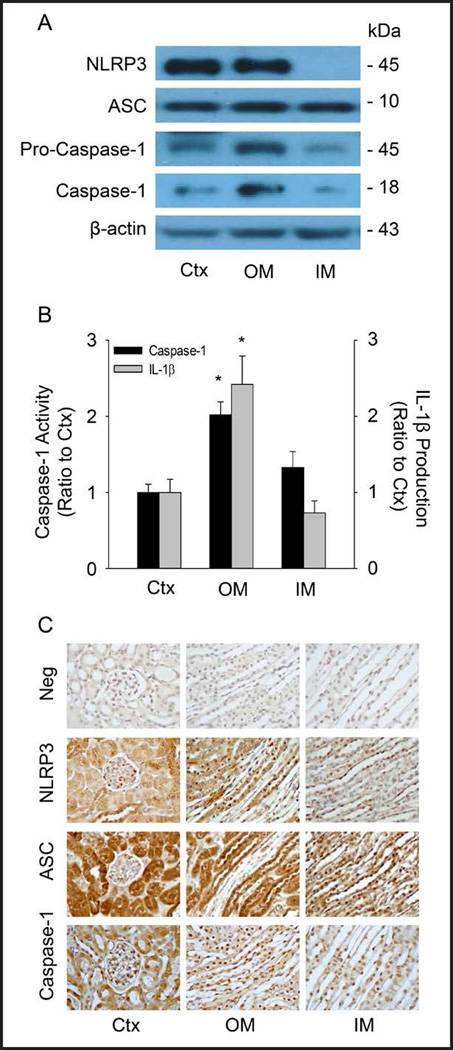
Fig. 1.
Characterizations of Nlrp3 inflammasome components in mouse kidney. (A) Western blot analysis showing the protein expression of Nlrp3, Asc, pro-caspase-1 and cleaved caspase-1 in the different areas of the mouse kidney. Ctx: cortex, OM: outer medulla, IM: inner medulla. n=4 mice per group. (B) Values are arithmetic means ± SEM (n=4 each group) of caspase-1 activity and IL-1β production in different areas of the mouse kidney. * P<0.05 vs. Control (Ctx). (C) Immunohistochemical analysis of inflammasome molecules in the mouse kidney. Neg: negative control, Ctx: Control.

