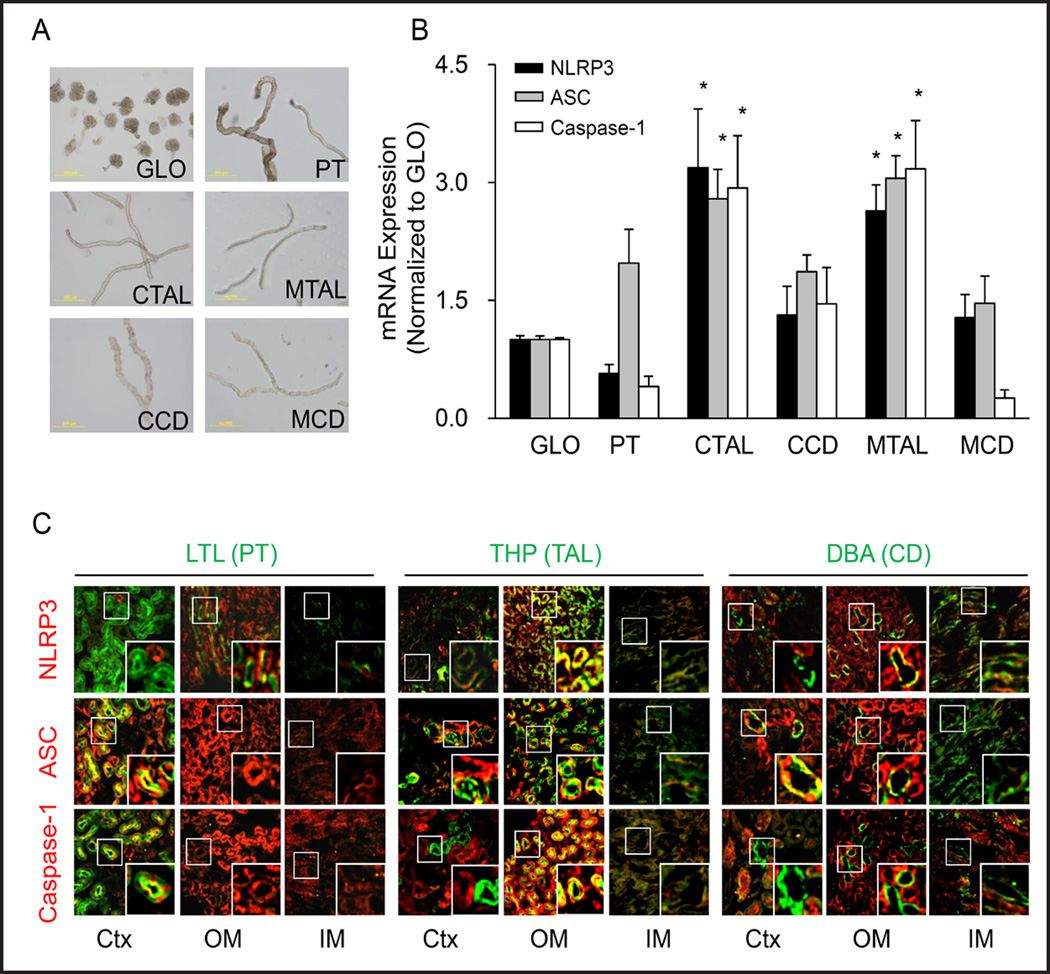
Fig. 2.
Distribution of Nlrp3 inflammasome components in different nephron segments. (A) Representative images of isolated nephron fragments: glomeruli (GLO), proximal tubule (PT), cortical thick ascending limb (CTAL), medullary thick ascending limb (MTAL), cortical connecting tubule (CCD) and medullary connecting tubule (MCD). (B) Quantitative RT-PCR analysis showing the distribution of Nlrp3, Asc and caspase-1 mRNA levels in different nephron segments. Values are arithmetic means ± SEM (n=6 mice per group), * P<0.05 vs. glomeruli. (C) Fluorescent confocal microscopic images showing co-localization of inflammasome components (red): Nlrp3, Asc or caspase-1 with different renal tubular markers (green): Proximal tubule (PT) marker: Lotus tetragonolobus Agglutinin (LTL); Thick ascending limb (TAL) marker: Tamm-Horsfall protein antibody (THP); and Connecting tubule (CD) marker: Dolichos biflorus agglutinin (DBA) in mouse.

