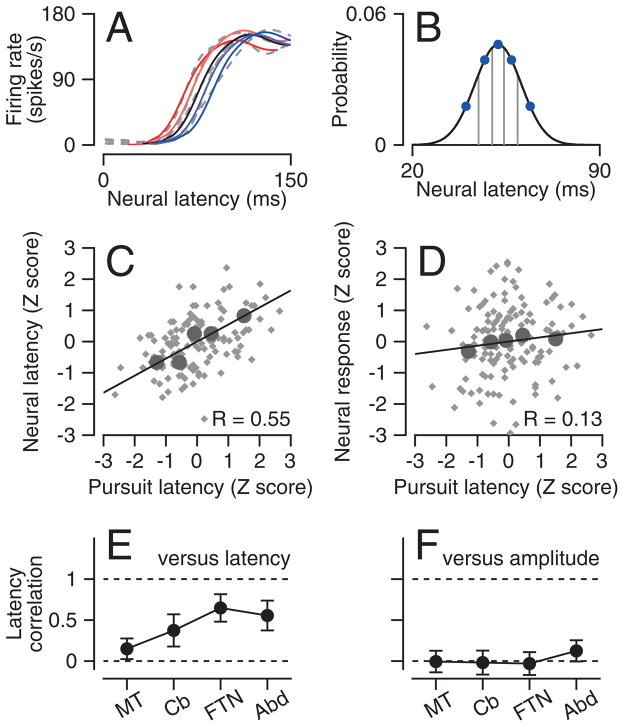
Figure 3. Neuron-behavior correlations for neural response latency or amplitude.
A: Colored solid lines show the scaled and translated templates that provided the best fits to the dashed gray lines, which show averages of the five quintiles of responses with different pursuit latencies. B: Curve shows the Gaussian estimates of the distribution of latency for the neuron and blue symbols show the data used to derive the curve. C, D: Scatter plots one neuron showing z-scores of neural latency (C) and response amplitude (D) versus z-scores of pursuit latency. Gray and black symbols show estimates for all individual trials and averages for each of the 5 quintiles. Lines show the results of regression analysis. E, F: Population neuron-behavior correlations at each recording site for neural latency (E) and neural response amplitude (F). Error bars are standard deviations across neurons.

