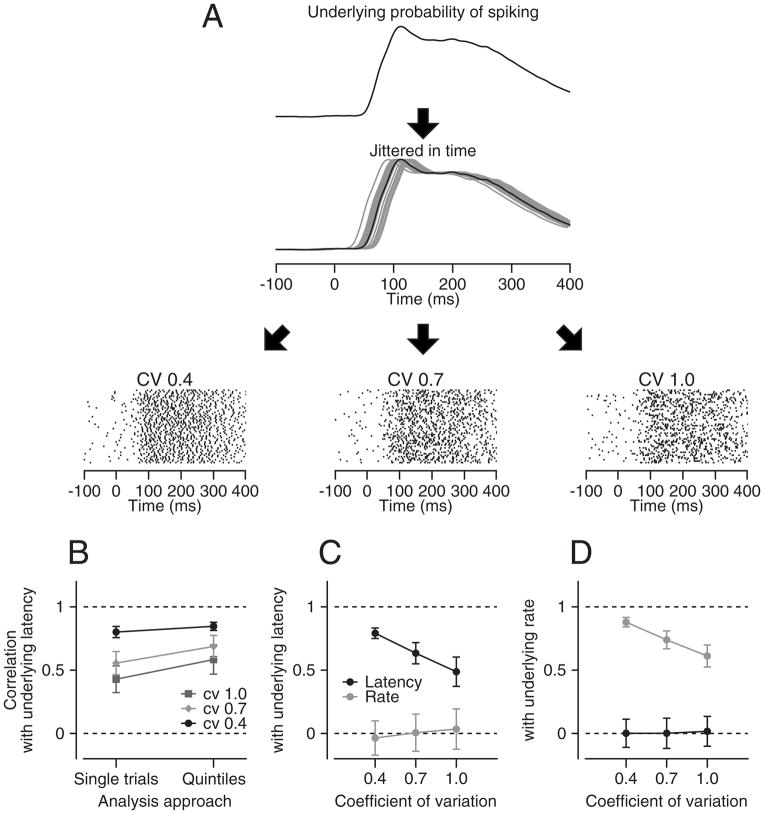
Figure 4. Procedure for evaluating accuracy of neural latency estimates.
A: schematic showing how we simulated spike trains from by the underlying probability of firing. The rasters show simulations of 100 trials for 3 coefficients of variation (CV). B: Comparison of analysis done on single trials versus on trials divided into quintiles. C, D: Analysis of how well the analysis procedure could separate variation in latency versus amplitude of the underlying probability of firing. The y-axes plot the correlation between the actual latency (C) or the underlying probability of firing (D) with the latency or rate measured from the spike trains. Error bars are standard deviations from 100 repeats.

