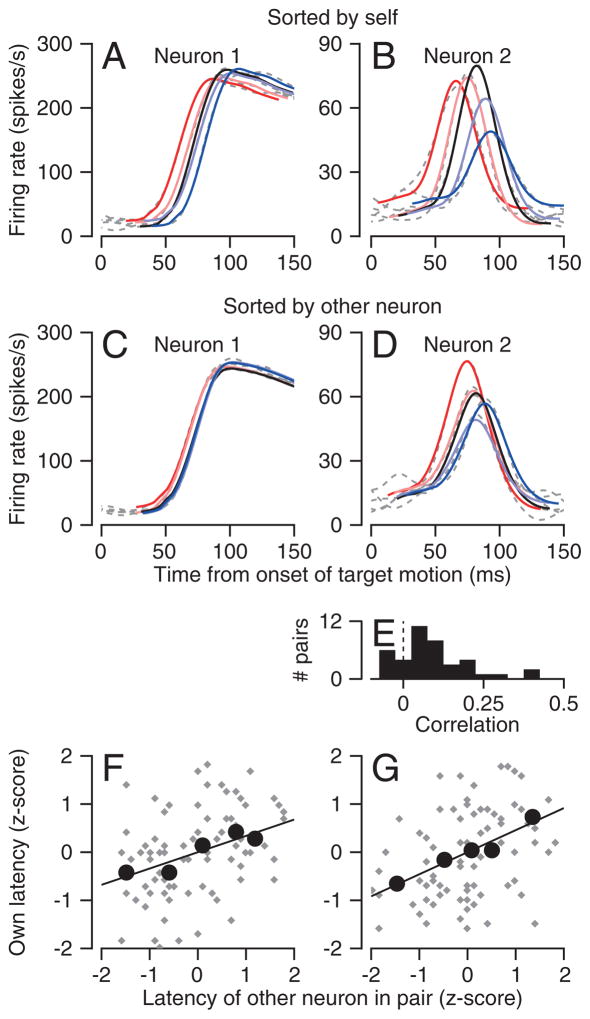
Figure 5. Neuron-neuron correlation for latency in area MT.
A, B: Quintiles of spike density functions of the quintiles of two neurons recorded at the same time. C, D: Spike density functions of the same neurons, sorted according to neural response latency of the other neuron in the pair. In A–D, the colors and dashed gray traces show the scaled and translated templates and the averages of spike density. E: Distribution of neuron-neuron latency correlations in MT. F, G: Scatter plots showing the z-score of the latency of one neuron as a function of the z-score of the latency of the other neuron in the pair. Gray and black symbols show data for single trials and averages across the 5 quintiles. Lines show the result of linear regression. The two graphs plot analysis of a single data set performed separately on the basis of the latency of each neuron.

