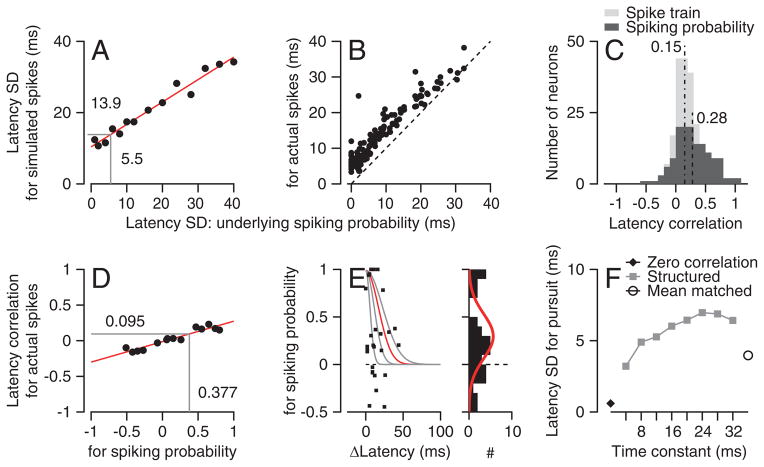
Figure 6. Effect of neuron-neuron latency correlations on the variation of behavioral latency.
A: Relationship between the standard deviation of latency for simulated spikes and the underlying probability of spiking in a model MT neuron. B: Symbols show the relationship between standard deviation of latency measured from actual spike trains and for the underlying probability of spiking for a sample of MT neurons. Dashed line shows equality line. C: Distribution of MT-pursuit latency correlations. Black and gray histograms show values for actual spike trains and for the underlying probability of spiking. Vertical dashed lines show the population means. D: Relationship between the neuron-neuron latency correlation for simulated spikes and the underlying probability of spiking in a pair of model MT neurons. E: Each symbol shows neuron-neuron correlations in the underlying probability of spiking for a pair of neurons as a function of the latency difference between the two neurons. The gray and red exponential functions show potential descriptions of the data with different “delta-latency” constants. The marginal histogram summarizes the distribution of neuron-neuron latency correlations in the underlying probability of spiking. The red curve shows a Gaussian fit used to create model populations. F: Latency variation of pursuit under different assumptions about neuron-neuron latency correlations in a model population response. Filled diamond, neuron-neuron latency correlations were absent; gray symbols, structured correlations with different “delta-latency” time constants; open symbol, uniform neuron-neuron latency correlations with the same mean value as the data.

