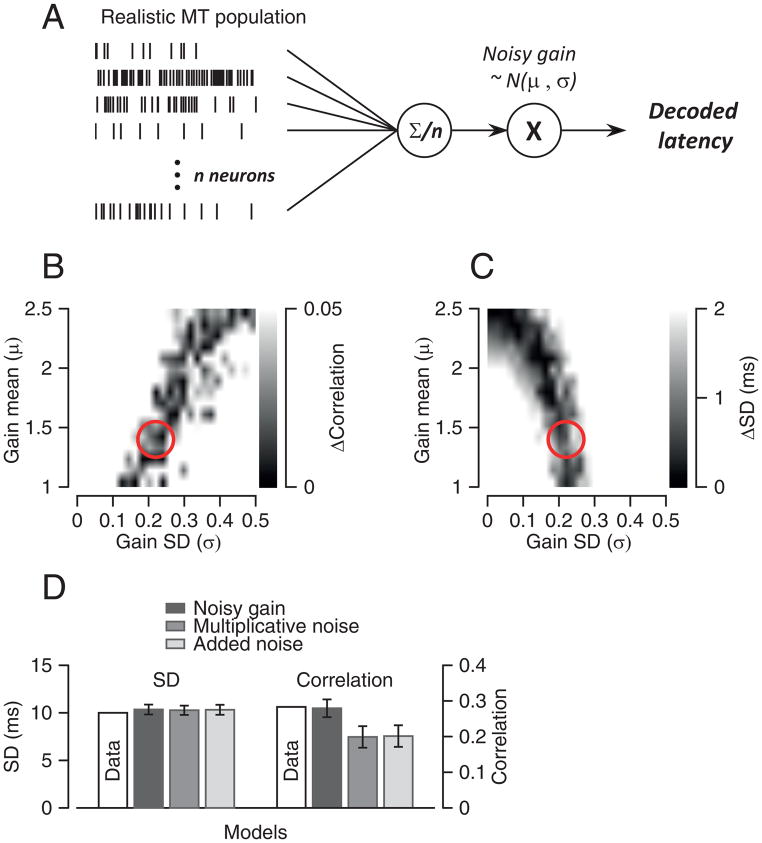
Figure 7. Model that uses downstream noise to account for statistics of pursuit latency.
A: Schematic diagram of a model that uses a realistic model MT population response, an averaging population decoder, and noisy gain downstream from decoding. B, C: Gray scale representation of the difference between simulated and actual MT-pursuit correlations (B) and latency standard deviation (C) as a function of the value of downstream gain (y-axis) and the value of the downstream noise SD (x-axis). Red circles show the parameters that provide the best prediction of the actual data for both parameters. D: Comparisons among models. Error bars are standard deviations obtained from running each simulation 100 times.

