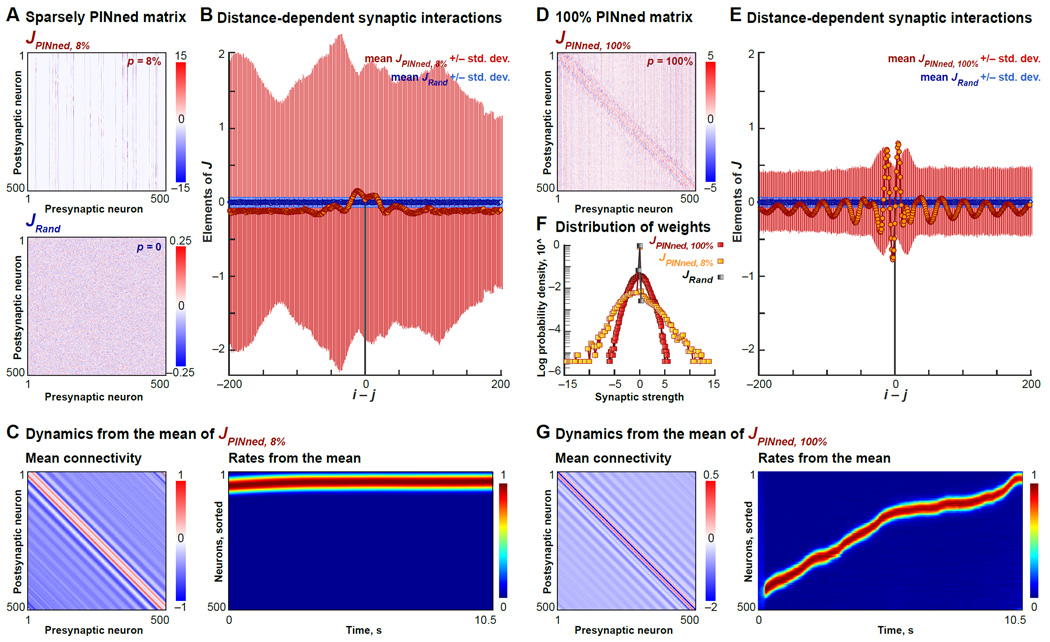
Figure 3. Properties of PINned Connectivity Matrices.
A. Synaptic connectivity matrix of a 500-neuron network with p = 8% producing an idealized sequence with pVar = 92% (highlighted by a red circle in Figure S2B), denoted by JPINned, 8%, and that of the randomly initialized network with p = 0, denoted by JRand, are shown here. Colorbars indicate, in pseudocolor, the magnitudes of synaptic strengths after PINning.
B. Influence of neurons away from the sequentially active neurons is estimated by computing the mean (circles) and the standard deviation (lines) of the elements of JRand (in blue) and JPINned, 8% (in orange) in successive off-diagonal “stripes” away from the principal diagonal. These quantities are plotted as a function of the “inter-neuron distance”, i − j. In units of i − j, 0 corresponds to the principal diagonal or self-interactions, and the positive and the negative terms are the successive interaction magnitudes a distance i − j away from the primary sequential neurons.
C. Dynamics from the band-averages of JPINned, 8% are shown here. Left panel is a synthetic matrix generated by replacing the elements of JPINned, 8% by their means (orange circles in (B)). The normalized activity from a network with this synthetic connectivity is shown on the right. Although there is a localized “bump” around i − j = 0 and long range inhibition, these features lead to fixed point activity.
D. Same as panel (A), except for the connectivity matrix from a fully PINned (p = 100%) network, denoted by JPINned, 100%.
E. Same as (B), except comparing JPINned, 100% and JRand.. Band-averages (orange circles) are bigger and more asymmetric compared to those for JPINned, 8%. Notably, these band-averages are also negative for i − j = 0 and in the neighborhood of 0.
F. Log of the probability density of the elements of JRand (gray squares), JPINned, 8% (yellow squares) and for comparison, JPINned, 100% (red squares) are shown here.
G. Same as panel (C), except showing the firing rates from the mean JPINned, 100%. In contrast with JPINned, 8%, the band averages of JPINned, 100% can be sufficient to evoke a “Gaussian bump” qualitatively similar to the moving bump evoked by a ring attractor model, since its movement is driven by the asymmetry in the mean connectivity.

